Study S10 · generated 2026-10-13T21:32:40+00:00 · 11.3 s
Susceptible vs resilient: neural correlates of the CSDS phenotype
Which per-animal network, activity and coding measures separate the lab-classified susceptible and resilient mice?
Question
Do susceptible and resilient mice differ in how their neuronal activity, functional networks and population codes respond to defeat, and in how those responses evolve across days?
Background & rationale
Only a subset of mice subjected to CSDS develop lasting social avoidance (susceptible); the rest remain resilient (Krishnan et al. 2007; Golden et al. 2011). Resilience is an active process with its own neural signatures. Pre-stress nucleus accumbens D1-MSN activity predicts later resilience (Muir et al. 2018), a brain-wide electrical network signature tracks vulnerability (Hultman et al. 2018), and susceptible and resilient mice differ in large-scale functional connectivity after CSDS (Mol Psychiatry 2025). Hippocampal social coding also differs between the phenotypes (Biol Psychiatry Glob Open Sci 2025). Here the lab classified 3 mice as resilient (4703, 6597, 6669) and 3 as susceptible (6445, 6672, 6675), so we can ask which single-neuron network measures, measured during the defeat period, differ between the groups.
Methodology
Per-animal features (days 1–9 without day 7). * Behavior (S01): defeat-response index (fraction of SD time submissive + freezing + escape) and the annotation-based SI proxy. * Activity and networks (S02, S04): for event rate, mean pairwise correlation, significant-edge density, clustering, global efficiency and modularity, the animal's baseline (BL) mean and the defeat response (SD − BL) and sensory-stress response (SS − BL), computed over days on which the animal has all of BL, SD and SS. * Reorganisation (S06): FC context specificity and the drift slope of SD networks (similarity per day of separation, from the pairwise session similarities). * Coding (S08): context-decoding accuracy and behavior-decoding accuracy above each animal's own null.
Group comparison. For each feature, the susceptible − resilient mean difference was tested with an exact permutation test over all 20 ways of labelling 3 of the 6 animals as susceptible (two-sided). With 3 vs 3 the smallest attainable p is 0.10, which happens only when the groups are completely separated. The study therefore reports Hedges' g and complete separation (every susceptible value above, or below, every resilient value) as the primary descriptors. Under the null, any given feature shows complete separation with probability 0.10. BH-FDR q-values are reported for completeness.
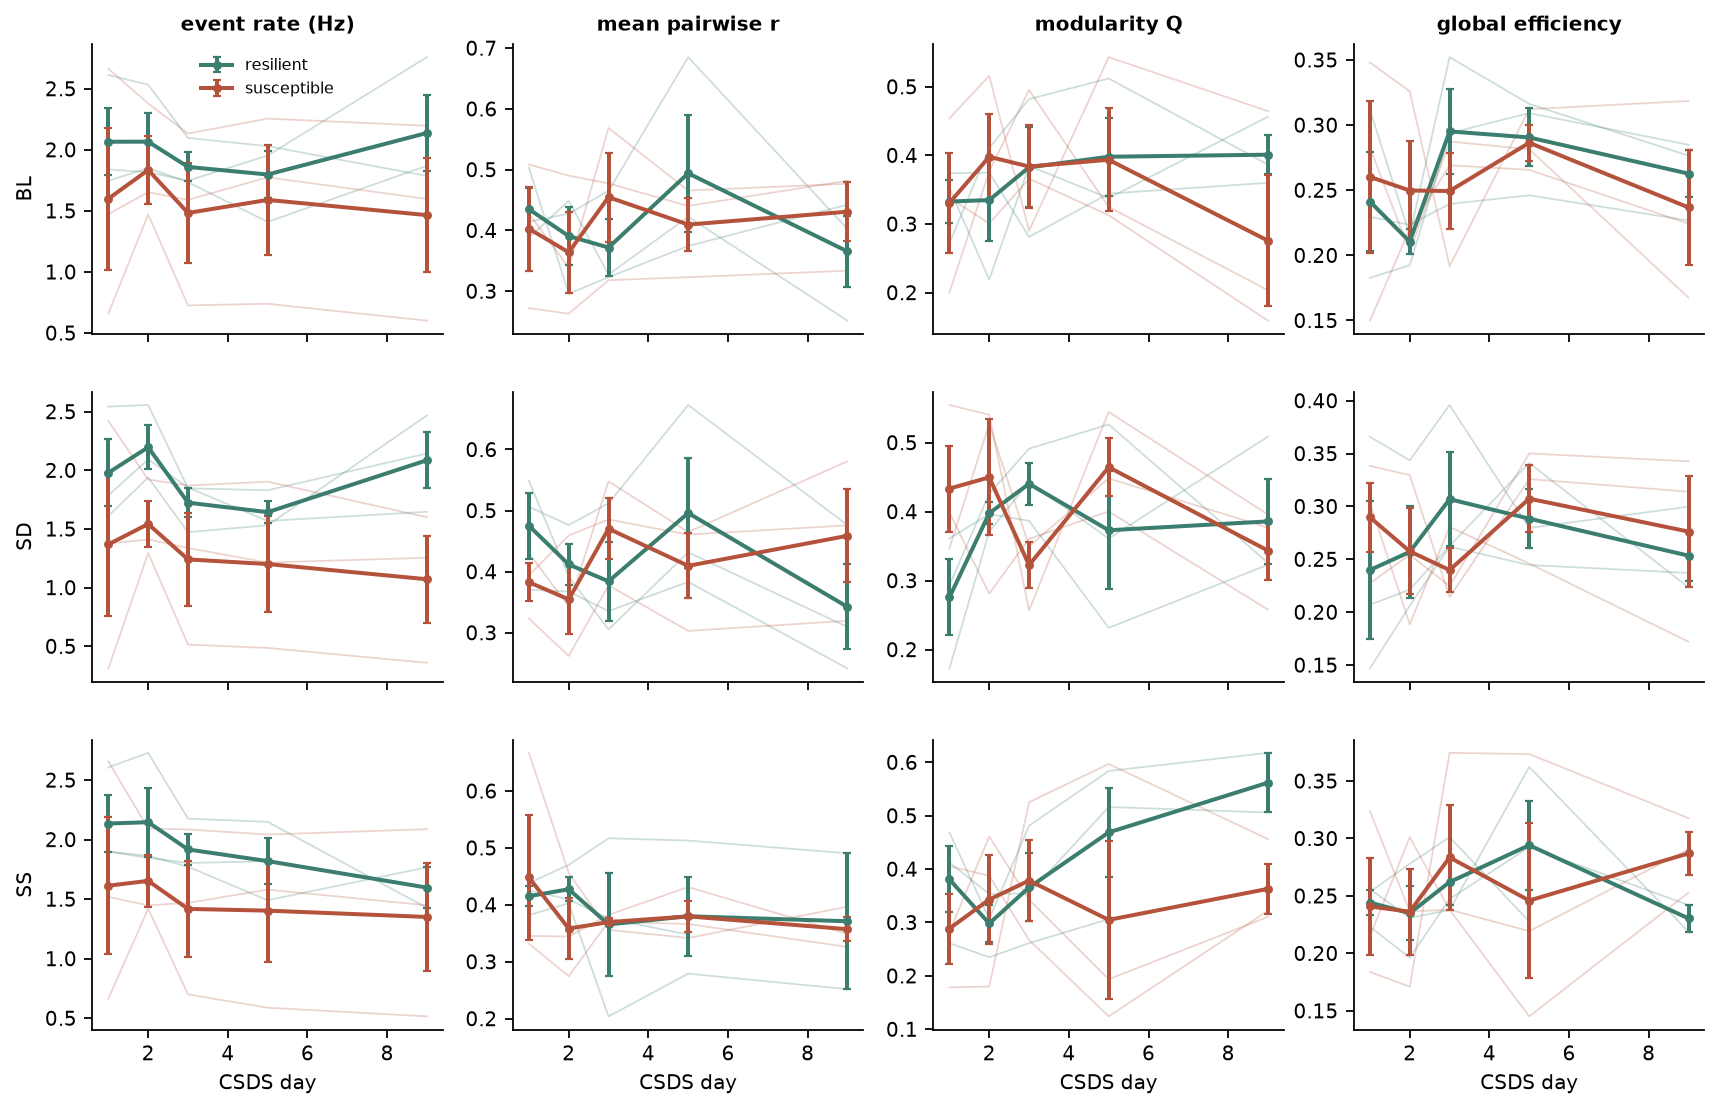
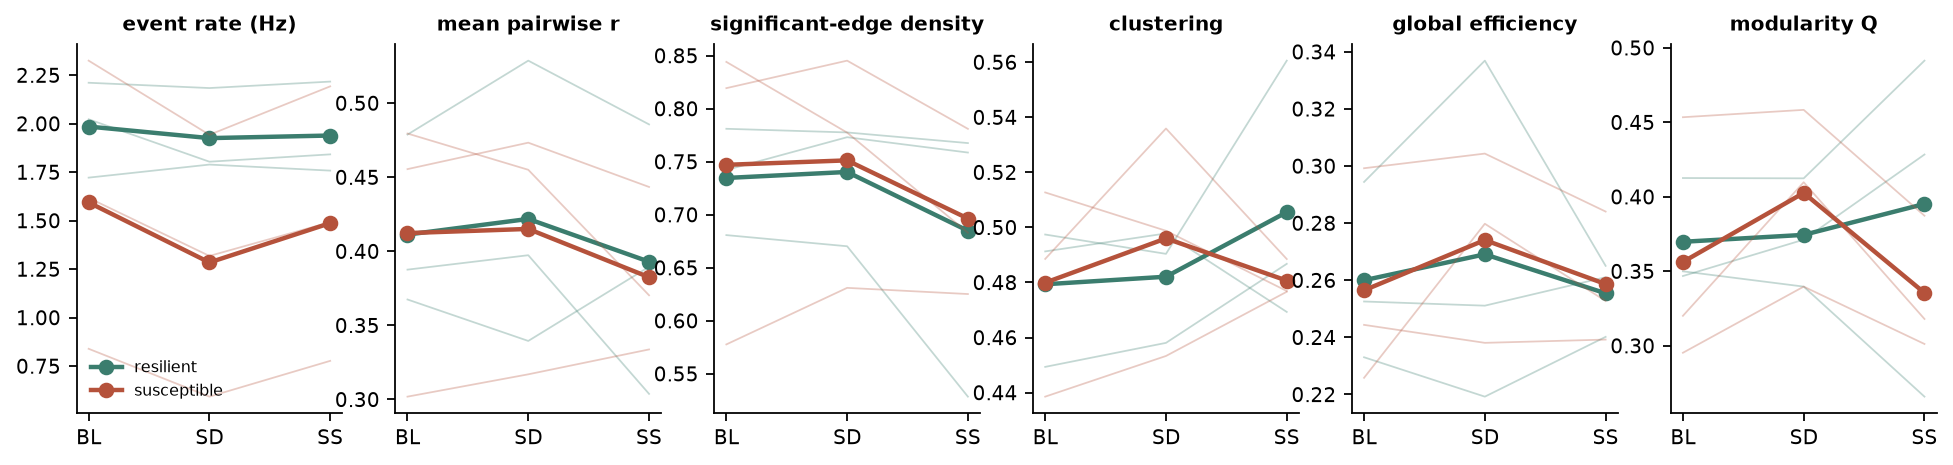
Trajectories. Session-level measures were averaged per phenotype for each recording day and condition to show whether the groups diverge as defeats accumulate.
Continuous coupling. Spearman ρ (exact, 720 permutations) between each neural feature and the defeat-response index.
Parameters
| Parameter | Value |
|---|---|
groups | lab classification (3 vs 3) |
test | exact permutation (20) |
days | 1, 2, 3, 5, 9 (day 7 excluded) |
Highlights
info
Phenotype groups
3 susceptible · 3 resilient
Lab classification: resilient 4703, 6597, 6669; susceptible 6445, 6672, 6675.
null
Features separating the groups
2/25
Complete separation of susceptible and resilient animals; ≈2.5 expected by chance (binomial p = 0.73, ignoring correlations among features).
info
event rate (Hz) · SS − BL
g = -3.22
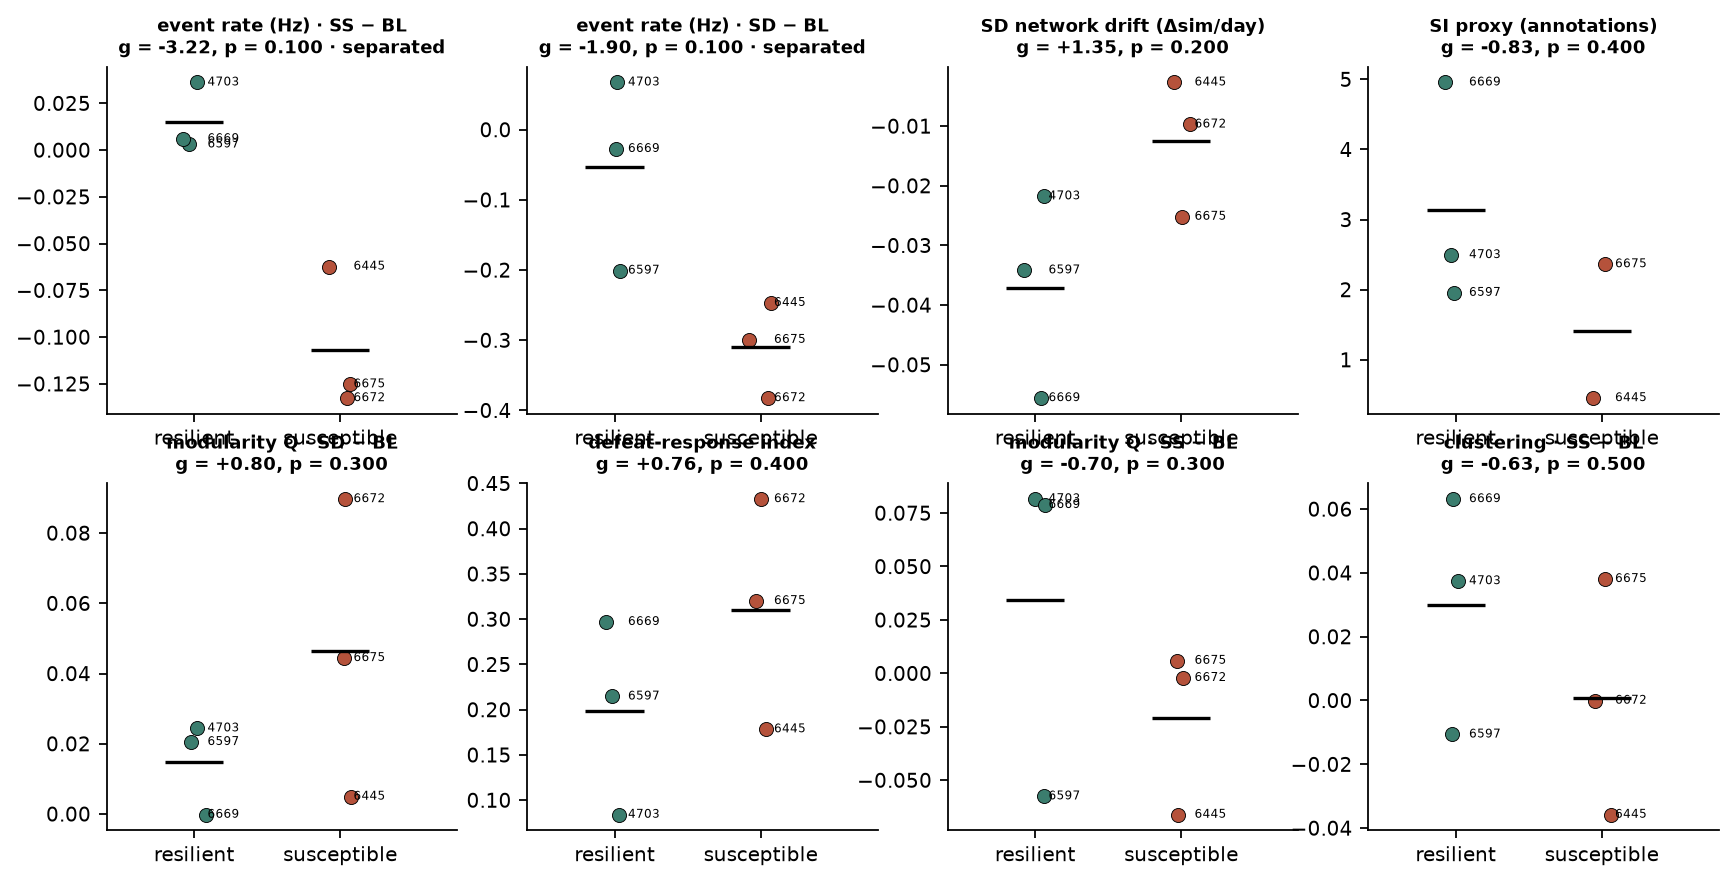
Susceptible lower (-0.107 vs 0.0151), complete separation, exact p = 0.100 (minimum attainable).
info
event rate (Hz) · SD − BL
g = -1.90
Susceptible lower (-0.31 vs -0.0536), complete separation, exact p = 0.100 (minimum attainable).
caution
Power
n = 3 per group
No 3-vs-3 comparison can reach p < 0.05; these are candidate markers.
Results
Group separation. Of 25 per-animal features, 2 completely separated the 3 susceptible from the 3 resilient mice, against ≈2.5 expected by chance: event rate (Hz) · SS − BL (g = -3.22, susceptible < resilient); event rate (Hz) · SD − BL (g = -1.90, susceptible < resilient). The chance of seeing at least this many separating features is p = 0.73 (binomial, treating features as independent; they are correlated, so this is optimistic). The count is compatible with chance, so no single feature should be read as a phenotype marker. Each such feature has the minimum attainable exact p of 0.10. Table 1 lists all features ranked by separation and |Hedges' g|, and Figure 1 shows the strongest ones per animal.
Largest effects. event rate (Hz) · SS − BL: susceptible -0.107 vs resilient 0.0151 (g = -3.22); event rate (Hz) · SD − BL: susceptible -0.31 vs resilient -0.0536 (g = -1.90); SD network drift (Δsim/day): susceptible -0.0125 vs resilient -0.0372 (g = +1.35); SI proxy (annotations): susceptible 1.41 vs resilient 3.13 (g = -0.83); modularity Q · SD − BL: susceptible 0.0464 vs resilient 0.0149 (g = +0.80).
Trajectories. Figure 2 shows activity and network measures per recording day for each phenotype in BL, SD and SS sessions. Figure 3 shows the BL → SD → SS profile of each group.
Interpretation. With three animals per group, this analysis cannot establish a phenotype difference. Features that separate the groups and agree with prior literature are the natural pre-registered hypotheses for a larger cohort.
Figures
Tables
Table 1. Susceptible vs resilient: per-animal features
| feature | susceptible_mean | resilient_mean | difference | hedges_g | complete_separation | p_exact | n_relabelings | rho_defeat_index | p_rho | q_fdr |
|---|---|---|---|---|---|---|---|---|---|---|
| event rate (Hz) · SS − BL | -0.107 | 0.0151 | -0.122 | -3.22 | True | 0.1 | 20 | -0.771 | 0.103 | 1 |
| event rate (Hz) · SD − BL | -0.31 | -0.0536 | -0.256 | -1.9 | True | 0.1 | 20 | -0.771 | 0.103 | 1 |
| SD network drift (Δsim/day) | -0.0125 | -0.0372 | 0.0246 | 1.35 | False | 0.2 | 20 | -0.143 | 0.803 | 1 |
| SI proxy (annotations) | 1.41 | 3.13 | -1.73 | -0.825 | False | 0.4 | 10 | 0.2 | 0.783 | 1 |
| modularity Q · SD − BL | 0.0464 | 0.0149 | 0.0315 | 0.801 | False | 0.3 | 20 | 0.486 | 0.356 | 1 |
| defeat-response index | 0.31 | 0.199 | 0.112 | 0.76 | False | 0.4 | 20 | 1 | ||
| modularity Q · SS − BL | -0.0208 | 0.0343 | -0.0551 | -0.701 | False | 0.3 | 20 | -0.0857 | 0.919 | 1 |
| clustering · SS − BL | 0.000752 | 0.03 | -0.0292 | -0.628 | False | 0.5 | 20 | 0.314 | 0.564 | 1 |
| FC context specificity | 0.00104 | 0.0091 | -0.00806 | -0.615 | False | 0.4 | 20 | -0.2 | 0.714 | 1 |
| event rate (Hz) · BL | 1.59 | 1.92 | -0.33 | -0.475 | False | 0.6 | 20 | 0.543 | 0.297 | 1 |
| decoding behavior SD (above null) | 0.0644 | 0.0555 | 0.00882 | 0.371 | False | 0.6 | 20 | -0.257 | 0.658 | 1 |
| decoding behavior BL+SS (above null) | 0.102 | 0.098 | 0.00397 | 0.287 | False | 0.8 | 20 | 0.371 | 0.497 | 1 |
| global efficiency · SS − BL | 0.00219 | -0.00607 | 0.00826 | 0.287 | False | 0.7 | 20 | 0.486 | 0.356 | 1 |
| global efficiency · SD − BL | 0.0176 | 0.0107 | 0.00691 | 0.172 | False | 0.6 | 20 | 0.486 | 0.356 | 1 |
| clustering · SD − BL | 0.0161 | 0.0111 | 0.00495 | 0.154 | False | 0.9 | 20 | 0.6 | 0.242 | 1 |
| mean pairwise r · SD − BL | 0.00281 | 0.00906 | -0.00625 | -0.149 | False | 1 | 20 | -0.486 | 0.356 | 1 |
| significant-edge density · SS − BL | -0.0507 | -0.0635 | 0.0128 | 0.112 | False | 1 | 20 | -0.0857 | 0.919 | 1 |
| global efficiency · BL | 0.256 | 0.262 | -0.00502 | -0.111 | False | 0.8 | 20 | -0.429 | 0.419 | 1 |
| clustering · BL | 0.48 | 0.476 | 0.00436 | 0.11 | False | 0.9 | 20 | -0.0857 | 0.919 | 1 |
| mean pairwise r · BL | 0.412 | 0.421 | -0.00868 | -0.0903 | False | 0.9 | 20 | -0.429 | 0.419 | 1 |
| modularity Q · BL | 0.356 | 0.361 | -0.00467 | -0.0546 | False | 0.9 | 20 | -0.657 | 0.175 | 1 |
| decoding context BL/SD/SS (above null) | 0.129 | 0.134 | -0.00509 | -0.0382 | False | 1 | 20 | -0.714 | 0.136 | 1 |
| mean pairwise r · SS − BL | -0.0298 | -0.028 | -0.00181 | -0.0235 | False | 0.9 | 20 | -0.0857 | 0.919 | 1 |
| significant-edge density · SD − BL | 0.00419 | 0.00482 | -0.000626 | -0.0107 | False | 1 | 20 | 0.0857 | 0.919 | 1 |
| significant-edge density · BL | 0.747 | 0.748 | -0.00131 | -0.00939 | False | 1 | 20 | -0.257 | 0.658 | 1 |
Table 2. Per-animal feature matrix
| subject | event rate (Hz) · BL | mean pairwise r · BL | significant-edge density · BL | clustering · BL | global efficiency · BL | modularity Q · BL | event rate (Hz) · SD − BL | mean pairwise r · SD − BL | significant-edge density · SD − BL | clustering · SD − BL | global efficiency · SD − BL | modularity Q · SD − BL | event rate (Hz) · SS − BL | mean pairwise r · SS − BL | significant-edge density · SS − BL | clustering · SS − BL | global efficiency · SS − BL | modularity Q · SS − BL | defeat-response index | SI proxy (annotations) | FC context specificity | SD network drift (Δsim/day) | decoding behavior BL+SS (above null) | decoding behavior SD (above null) | decoding context BL/SD/SS (above null) | phenotype |
|---|---|---|---|---|---|---|---|---|---|---|---|---|---|---|---|---|---|---|---|---|---|---|---|---|---|---|
| 4703 | 1.72 | 0.479 | 0.781 | 0.449 | 0.233 | 0.347 | 0.0673 | 0.0499 | -0.00344 | 0.00872 | -0.0138 | 0.0244 | 0.0362 | 0.00687 | -0.0135 | 0.0374 | 0.00715 | 0.0816 | 0.084 | 2.49 | 0.0212 | -0.0218 | 0.0877 | 0.0465 | 0.256 | resilient |
| 6445 | 0.839 | 0.455 | 0.819 | 0.513 | 0.299 | 0.453 | -0.247 | 0.0178 | 0.0259 | -0.0139 | 0.00513 | 0.00495 | -0.0623 | -0.012 | -0.0384 | -0.0358 | -0.0152 | -0.0661 | 0.178 | 0.454 | -0.00707 | -0.00268 | 0.0984 | 0.0857 | 0.175 | susceptible |
| 6597 | 1.84 | 0.396 | 0.783 | 0.48 | 0.299 | 0.323 | -0.201 | -0.0324 | 0.0284 | 0.0316 | 0.0473 | 0.0205 | 0.00304 | -0.00695 | -0.0247 | -0.0106 | -0.0339 | -0.0576 | 0.215 | 1.96 | 0.0108 | -0.0342 | 0.104 | 0.0642 | 0.156 | resilient |
| 6669 | 2.21 | 0.388 | 0.681 | 0.497 | 0.253 | 0.413 | -0.0274 | 0.00974 | -0.0105 | -0.00702 | -0.00146 | -0.000202 | 0.00596 | -0.0838 | -0.152 | 0.0631 | 0.0085 | 0.0788 | 0.297 | 4.96 | -0.0047 | -0.0556 | 0.102 | 0.0559 | -0.00955 | resilient |
| 6672 | 2.33 | 0.302 | 0.578 | 0.489 | 0.226 | 0.32 | -0.382 | 0.0151 | 0.0533 | 0.0474 | 0.054 | 0.0897 | -0.133 | 0.0319 | 0.0475 | -4.4e-05 | 0.0269 | -0.0021 | 0.433 | 0.00619 | -0.00972 | 0.0914 | 0.0363 | 0.0494 | susceptible | |
| 6675 | 1.62 | 0.48 | 0.844 | 0.439 | 0.244 | 0.295 | -0.299 | -0.0245 | -0.0667 | 0.0148 | -0.0063 | 0.0444 | -0.125 | -0.109 | -0.161 | 0.0381 | -0.00516 | 0.00591 | 0.32 | 2.36 | 0.00398 | -0.0252 | 0.116 | 0.0711 | 0.162 | susceptible |
Limitations
- n = 3 per group. No feature can reach p < 0.05, and with ~30 features about 3 would be expected to separate the groups by chance. Results identify candidate markers for a confirmatory cohort and are not evidence of a phenotype difference.
- Mouse 6597 has no sensory-stress block on day 9, so that animal's network features use days 1, 2, 3 and 5. Mouse 6669 lacks the SIT imaging block; day-1–9 features for that animal are complete. Day 7 is excluded for every mouse.
- No non-defeated control group, so "resilient" differences cannot be separated from "less affected by the assay".
References
- Krishnan V. et al. (2007) Molecular adaptations underlying susceptibility and resistance to social defeat in brain reward regions. Cell 131:391–404.
- Golden S.A. et al. (2011) A standardized protocol for repeated social defeat stress in mice. Nat Protoc 6:1183–1191.
- Muir J. et al. (2018) In vivo fiber photometry reveals signature of future stress susceptibility in nucleus accumbens. Neuropsychopharmacology 43:255–263.
- Hultman R. et al. (2018) Brain-wide electrical spatiotemporal dynamics encode depression vulnerability. Cell 173:166–180.
- Resting-state fMRI reveals altered functional connectivity associated with resilience and susceptibility to CSDS (2025) Mol Psychiatry. doi:10.1038/s41380-025-02897-2
- Diminished social memory and hippocampal correlates of social interactions in chronic social defeat stress susceptibility (2025) Biol Psychiatry Glob Open Sci. https://www.bpsgos.org/article/S2667-1743(25)00009-6/fulltext
- Button K.S. et al. (2013) Power failure: why small sample size undermines the reliability of neuroscience. Nat Rev Neurosci 14:365–376.