Study S05 · generated 2026-10-13T21:14:52+00:00 · 153.7 s
Communities, hubs and rich-club organisation
Ensemble (module) structure, connector hubs, rich clubs and their stability across days.
Question
Are neurons organised into stable co-active modules and hub neurons, and does defeat change hub roles, rich-club organisation or the day-to-day stability of modules?
Background & rationale
Modules in neuronal co-activity graphs correspond to cell assemblies, groups of neurons that fire together (Hebb 1949; Carrillo-Reid et al. 2016). Within modular networks, hub nodes can be classified by their within-module degree z and participation coefficient P into provincial and connector hubs (Guimerà & Amaral 2005). Rich-club organisation, densely interconnected high-degree nodes, is a recurrent feature of neural networks (van den Heuvel & Sporns 2011) and has been reported in cortical microcircuits (Nigam et al. 2016). Stress-related hippocampal network reorganisation is driven disproportionately by highly active neurons (Transl Psychiatry 2022), which motivates asking whether hubs change under defeat. Day-to-day stability of modules connects to work on representational drift (Ziv et al. 2013).
Methodology
Graphs. 10%-density proportional graphs per session (as in S04).
Modules. Louvain community detection (resolution 1, fixed seed). Modularity was compared with
circular-shift surrogates at equal density (Q − null Q, from S04).
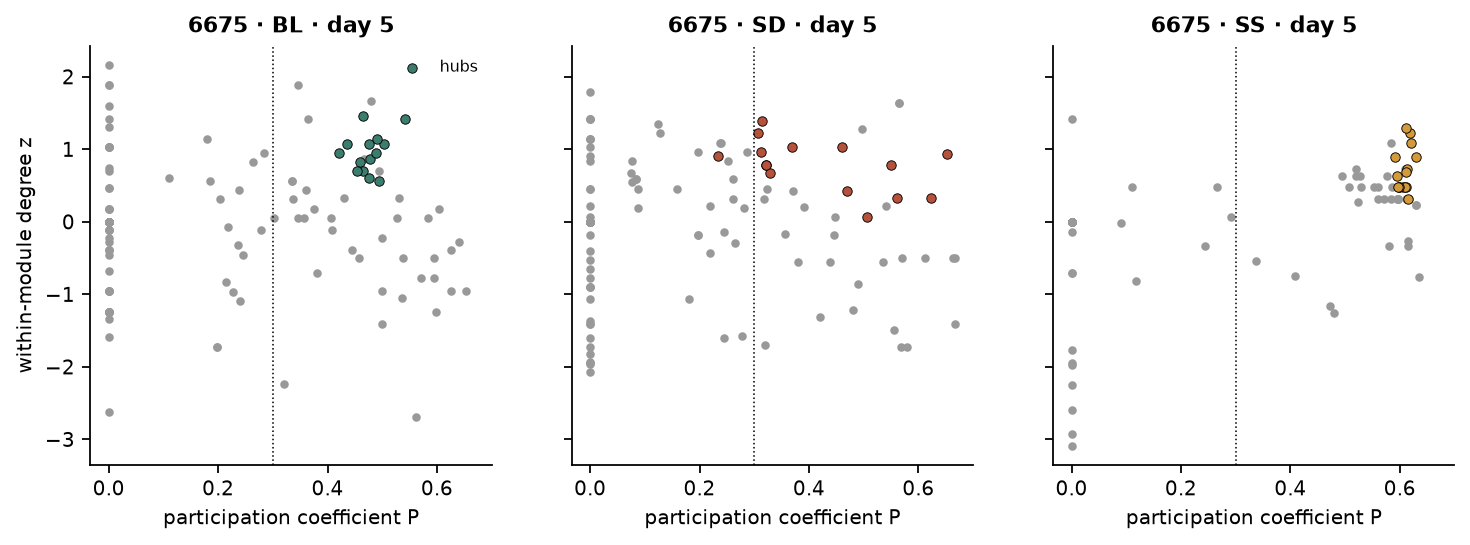
Cartography. For every neuron: within-module degree z and participation coefficient P (Guimerà & Amaral 2005). Hubs are neurons in the top 10% of degree. Of these, connector hubs have P > 0.3 and provincial hubs P ≤ 0.3. Session summaries: mean P of hubs, fraction of hubs that are connectors.
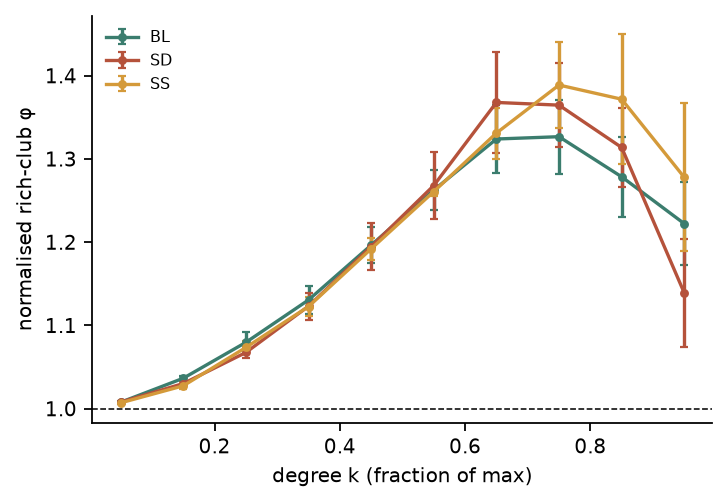
Rich club. Rich-club coefficient φ(k) was normalised by the mean of 10 degree-preserving rewired graphs (double-edge swaps). The session index is the mean normalised φ over k in the 70th–90th percentile of the degree distribution (> 1 indicates a rich club).
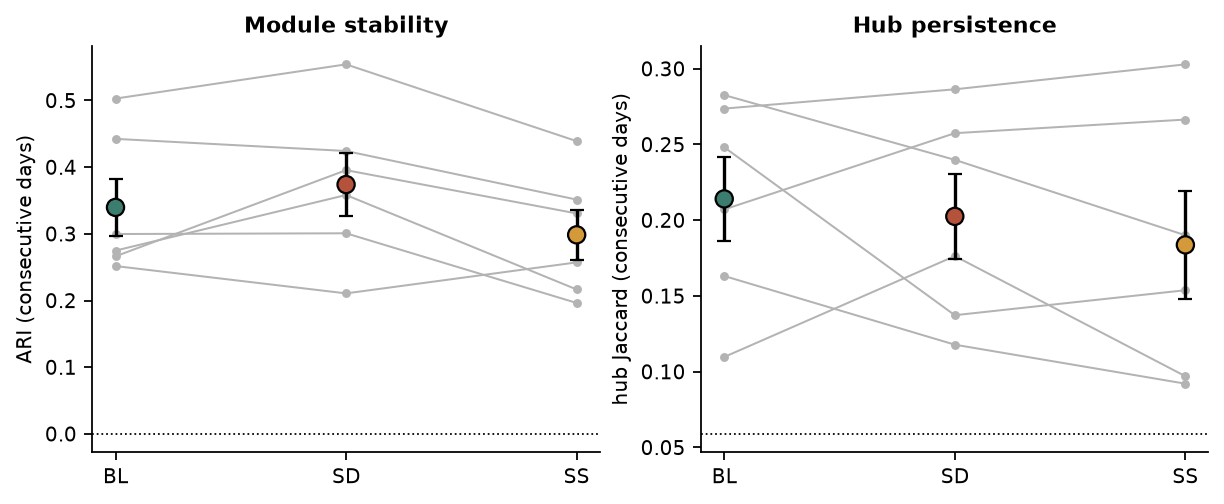
Stability. Because the same neurons are tracked across sessions, partitions are directly comparable. - Module stability: adjusted Rand index (ARI) between Louvain partitions of consecutive same-condition sessions (e.g. SD day 1 vs SD day 2), compared with ARI after permuting neuron labels (200 permutations). - Hub persistence: Jaccard overlap of hub sets between consecutive same-condition sessions vs the expectation for random sets of equal size.
Statistics. Per-animal means over days that contain all of BL, SD and SS (days 1–9 without day 7) were compared with Friedman and exact Wilcoxon tests, FDR-corrected across metrics × contrasts. Module and hub stability against their nulls were tested on per-animal means with one-sided exact Wilcoxon tests.
Parameters
| Parameter | Value |
|---|---|
density | 0.1 |
hub_quantile | 0.9 |
connector_P | 0.3 |
rich_club_rewires | 10 |
ari_permutations | 200 |
Highlights
significant
Modules persist across days
ARI = 0.337
Consecutive same-condition partitions agree above label-permutation null (-0.000), p = 0.016.
significant
Hub persistence
Jaccard 0.20
vs 0.06 expected for random hub sets, p = 0.016.
trend
hub participation P (SD vs BL)
-0.0605
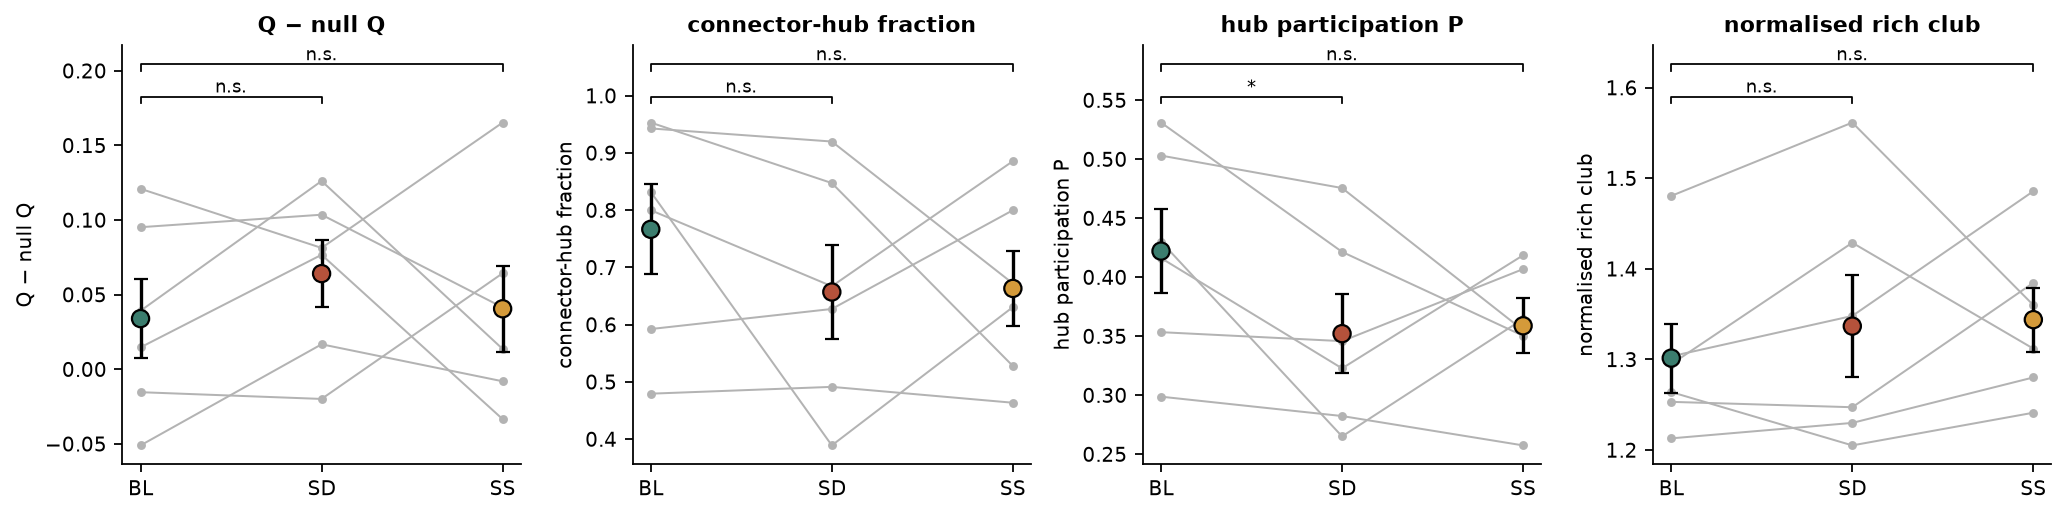
Strongest community/hub effect of defeat; p = 0.031, q = 0.375.
info
Rich club
normalised φ = 1.33
Mean over sessions in the 70th–90th degree percentile range (> 1 = rich-club organisation).
Results
Modular organisation. At 10% density, networks split into 7 non-trivial modules per session (median). Modularity exceeded circular-shift surrogates by 0.049 on average, indicating co-activity modules beyond what each neuron's own temporal statistics produce.
Hubs and rich club. Hubs (top 10% degree) had mean participation P = 0.38, and 70% of them were connector hubs. The normalised rich-club index averaged 1.33. Condition contrasts are in Table 1 and Figure 2. 0 of 12 tests survived FDR correction.
Stability across days. Partitions of consecutive same-condition sessions agreed above chance (mean ARI 0.337 vs -0.000; p = 0.016). Hub sets overlapped more than random sets (Jaccard 0.20 vs 0.06; p = 0.016). Module stability differed between conditions with Friedman p = 0.223 (Figure 4).
Figures
Tables
Table 1. Community and hub measures: condition contrasts
| metric | contrast | n | median_diff | dz | p | q_fdr | friedman_p |
|---|---|---|---|---|---|---|---|
| modularity_excess | SD vs BL | 6 | 0.0352 | 0.611 | 0.219 | 0.656 | 0.607 |
| modularity_excess | SS vs BL | 6 | 0.00868 | 0.117 | 1 | 1 | 0.607 |
| modularity_excess | SS vs SD | 6 | -0.0435 | -0.263 | 0.562 | 0.844 | 0.607 |
| connector_hub_fraction | SD vs BL | 6 | -0.0643 | -0.623 | 0.219 | 0.656 | 0.607 |
| connector_hub_fraction | SS vs BL | 6 | -0.108 | -0.435 | 0.438 | 0.75 | 0.607 |
| connector_hub_fraction | SS vs SD | 6 | 0.0724 | 0.0255 | 0.844 | 1 | 0.607 |
| hub_participation | SD vs BL | 6 | -0.0605 | -1.11 | 0.0312 | 0.375 | 0.115 |
| hub_participation | SS vs BL | 6 | -0.0534 | -0.713 | 0.219 | 0.656 | 0.115 |
| hub_participation | SS vs SD | 6 | 0.0181 | 0.072 | 1 | 1 | 0.115 |
| rich_club | SD vs BL | 6 | 0.0308 | 0.523 | 0.312 | 0.75 | 0.513 |
| rich_club | SS vs BL | 6 | 0.0422 | 0.389 | 0.438 | 0.75 | 0.513 |
| rich_club | SS vs SD | 6 | 0.0431 | 0.0517 | 0.844 | 1 | 0.513 |
Table 2. Day-to-day stability of modules and hubs
| subject | condition | ARI | ARI_null_mean | hub_jaccard | hub_jaccard_expected |
|---|---|---|---|---|---|
| 4703 | BL | 0.442 | 1.51e-05 | 0.207 | 0.0577 |
| 4703 | SD | 0.424 | -0.000637 | 0.257 | 0.0592 |
| 4703 | SS | 0.351 | 0.000313 | 0.266 | 0.0646 |
| 6445 | BL | 0.252 | -0.00021 | 0.11 | 0.0668 |
| 6445 | SD | 0.211 | -0.000932 | 0.176 | 0.057 |
| 6445 | SS | 0.257 | 0.000705 | 0.097 | 0.0639 |
| 6597 | BL | 0.266 | -0.00062 | 0.248 | 0.0572 |
| 6597 | SD | 0.396 | -0.000444 | 0.137 | 0.0554 |
| 6597 | SS | 0.331 | -0.00202 | 0.154 | 0.0581 |
| 6669 | BL | 0.3 | 0.000387 | 0.163 | 0.0607 |
| 6669 | SD | 0.301 | -0.000306 | 0.118 | 0.057 |
| 6669 | SS | 0.196 | 0.000209 | 0.0921 | 0.0598 |
| 6672 | BL | 0.503 | 0.00105 | 0.274 | 0.0589 |
| 6672 | SD | 0.554 | -0.000326 | 0.286 | 0.0556 |
| 6672 | SS | 0.439 | -0.000276 | 0.303 | 0.0556 |
| 6675 | BL | 0.275 | 0.000576 | 0.283 | 0.0558 |
| 6675 | SD | 0.358 | 0.000247 | 0.24 | 0.0604 |
| 6675 | SS | 0.217 | -0.000349 | 0.19 | 0.0568 |
Table 3. Session-level community metrics
| key | subject | condition | day | mapping | modularity_excess | n_modules | hub_participation | connector_hub_fraction | mean_participation | rich_club |
|---|---|---|---|---|---|---|---|---|---|---|
| 4703_BL_D1 | 4703 | BL | 1 | supported | 0.0267 | 5 | 0.461 | 1 | 0.25 | 1.33 |
| 4703_SD_D1 | 4703 | SD | 1 | supported | -0.353 | 6 | 0.355 | 1 | 0.191 | 1.08 |
| 4703_SS_D1 | 4703 | SS | 1 | supported | 0.0376 | 5 | 0.444 | 1 | 0.223 | 1.31 |
| 4703_BL_D2 | 4703 | BL | 2 | supported | -0.0434 | 4 | 0.282 | 0.455 | 0.138 | 1.34 |
| 4703_SD_D2 | 4703 | SD | 2 | supported | -0.00996 | 6 | 0.225 | 0.154 | 0.14 | 1.34 |
| 4703_SS_D2 | 4703 | SS | 2 | supported | -0.0601 | 4 | 0.375 | 1 | 0.18 | 1.25 |
| 4703_BL_D3 | 4703 | BL | 3 | supported | -0.0503 | 6 | 0.35 | 0.545 | 0.163 | 1.21 |
| 4703_SD_D3 | 4703 | SD | 3 | supported | 0.0439 | 7 | 0.472 | 1 | 0.255 | 1.53 |
| 4703_SS_D3 | 4703 | SS | 3 | supported | 0.02 | 6 | 0.53 | 1 | 0.244 | 1.4 |
| 4703_BL_D5 | 4703 | BL | 5 | supported | -0.0593 | 8 | 0.504 | 1 | 0.253 | 1.14 |
| 4703_SD_D5 | 4703 | SD | 5 | supported | 0.0229 | 9 | 0.438 | 1 | 0.179 | 1.27 |
| 4703_SS_D5 | 4703 | SS | 5 | supported | 0.16 | 5 | 0.324 | 0.5 | 0.196 | 1.27 |
Limitations
- Louvain is stochastic. A single seed was used per session; consensus clustering would reduce variability.
- BL, SD and SS are recorded in a fixed order within each day, so condition contrasts are confounded with position in the recording.
- The hub definition (top 10% degree, P > 0.3) follows common practice but is a choice. The direction of effects should be checked at other cut-offs.
- Rich-club normalisation with 10 rewired graphs per session gives coarse estimates.
References
- Guimerà R. & Amaral L.A.N. (2005) Functional cartography of complex metabolic networks. Nature 433:895–900.
- van den Heuvel M.P. & Sporns O. (2011) Rich-club organization of the human connectome. J Neurosci 31:15775–15786.
- Colizza V. et al. (2006) Detecting rich-club ordering in complex networks. Nat Phys 2:110–115.
- Nigam S. et al. (2016) Rich-club organization in effective connectivity among cortical neurons. J Neurosci 36:670–684.
- Carrillo-Reid L. et al. (2016) Imprinting and recalling cortical ensembles. Science 353:691–694.
- Ziv Y. et al. (2013) Long-term dynamics of CA1 hippocampal place codes. Nat Neurosci 16:264–266.
- Hubert L. & Arabie P. (1985) Comparing partitions. J Classif 2:193–218.