Study S02 · generated 2026-10-13T21:06:14+00:00 · 2.4 s
Neural activity across CSDS phases
Inferred firing, active-neuron fraction and behavior-locked population responses.
Question
Does the overall level of neural activity differ between baseline, defeat and post-defeat sensory contact, does it change across defeat days, and which behaviors drive population activity?
Background & rationale
Chronic social defeat changes the excitability of stress-related circuits. CSDS increases activity of prelimbic glutamatergic neurons and reduces PV interneuron activity (Nat Commun 2023). Resilient animals show elevated dCA1 inferred spike rates (Biol Psychiatry Glob Open Sci 2025), and the pre-stress activity of NAc D1-MSNs predicts later resilience (Muir et al. 2018). Changes in mean activity also matter methodologically: firing rate influences pairwise correlations and therefore network measures (de la Rocha et al. 2007; Cohen & Kohn 2011). Establishing activity effects is a prerequisite for interpreting the network studies that follow.
Methodology
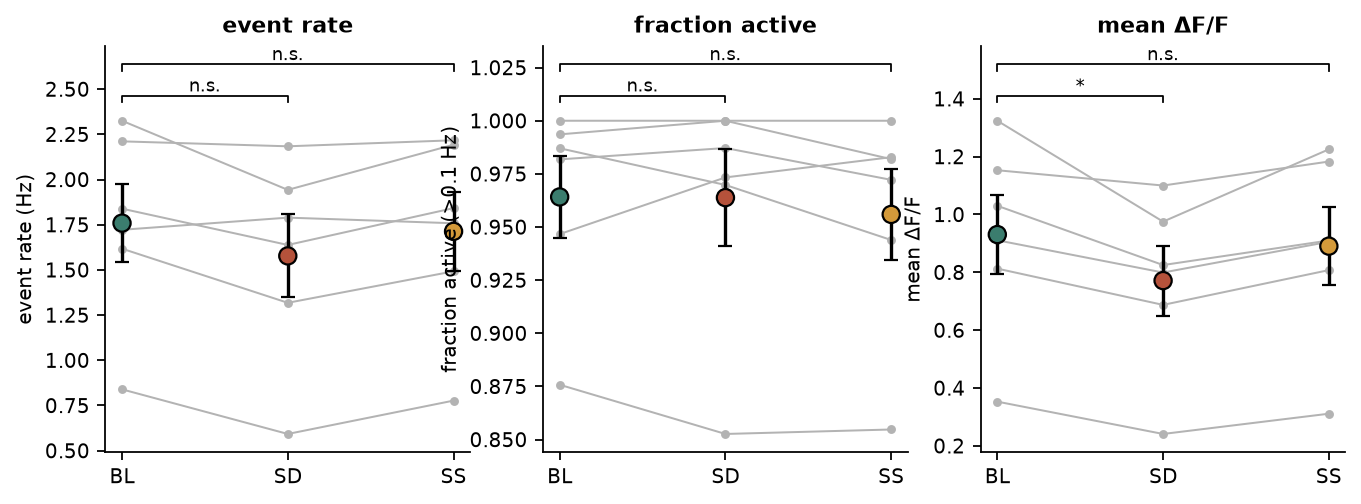
Signal. CASCADE-inferred spike probability (expected spikes per frame) multiplied by the frame rate gives an estimated event rate in Hz (Rupprecht et al. 2021). ΔF/F was analysed in parallel as a sensitivity check.
Session measures. For each neuron and session: mean event rate; active if mean rate exceeded 0.1 Hz. Session values are the mean over neurons and the fraction of active neurons.
Condition contrasts. Primary contrasts use days 1–9, day 7 excluded, where BL, SD and SS share a day, an
animal and a recording length (≈2,000 frames). Only days on which an animal has all three conditions enter its
means (this drops BL and SD of day 9 for 6597, which has no SS that day), so every condition mean averages the
same days. Per-animal condition means were compared with a Friedman test followed by exact Wilcoxon
signed-rank tests (SD vs BL, SS vs BL, SS vs SD). A session-level OLS with animal × day block fixed effects
(measure ~ condition + block) gives within-day effect estimates; its session-level p-values are descriptive
because sessions of one animal are not independent. The day trend within each condition was estimated per
animal and the per-animal slopes tested against 0 (exact Wilcoxon). P-values were FDR-corrected across
measures × contrasts.
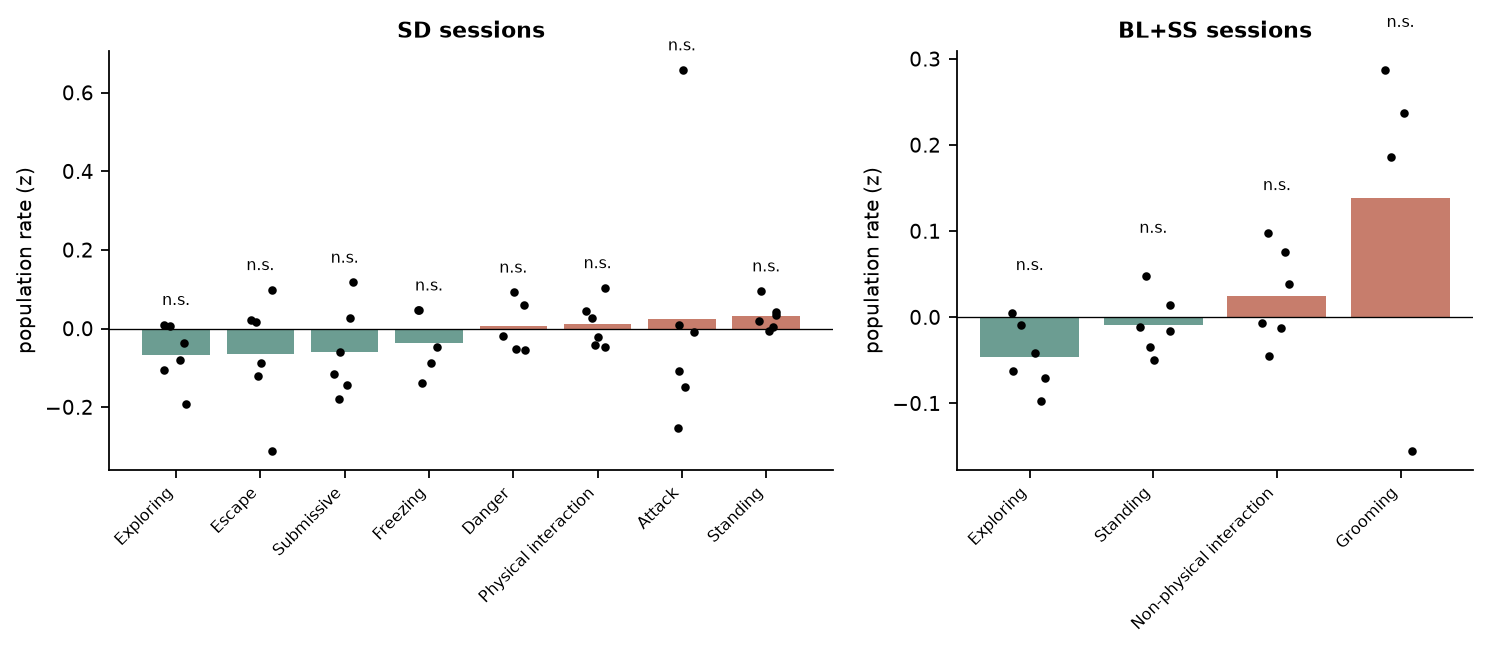
Behavior-locked population responses. Within each session, the population rate (mean over neurons) was z-scored, and its mean computed within each annotated behavior. Per-animal means (behaviors with ≥ 100 frames) were tested against 0 with exact Wilcoxon tests, separately for defeat sessions and for baseline/post-defeat sessions.
SIT. Population rate during the CD-1 phase was compared with the empty-enclosure phase (paired Wilcoxon).
Parameters
| Parameter | Value |
|---|---|
active_threshold_hz | 0.1 |
min_behavior_frames | 100 |
fs_hz | 6.666 |
Highlights
null
Firing during defeat
-0.224 Hz (SD − BL)
Median paired change in inferred event rate, 1/6 animals increased, p = 0.094; Friedman p = 0.135.
null
Population response: Exploring
z = -0.05
BL+SS sessions, 6 animals, p = 0.062 (q = 0.562).
null
Population response: Standing
z = +0.03
SD sessions, 6 animals, p = 0.094 (q = 0.562).
null
SIT CD-1 vs empty
+0.121 Hz
Population rate change when the CD-1 is present, p = 0.188.
Results
Activity levels. Mean inferred event rates on days 1–9, day 7 excluded were BL 1.759 Hz, SD 1.577 Hz and SS 1.713 Hz (animal means; Friedman p = 0.135). For SD vs BL, the median paired difference was -0.224 Hz (1/6 animals higher during defeat, p = 0.094, q = 0.211). All contrasts for rate, active fraction and ΔF/F are in Table 1; fixed-effect estimates are in Table 2.
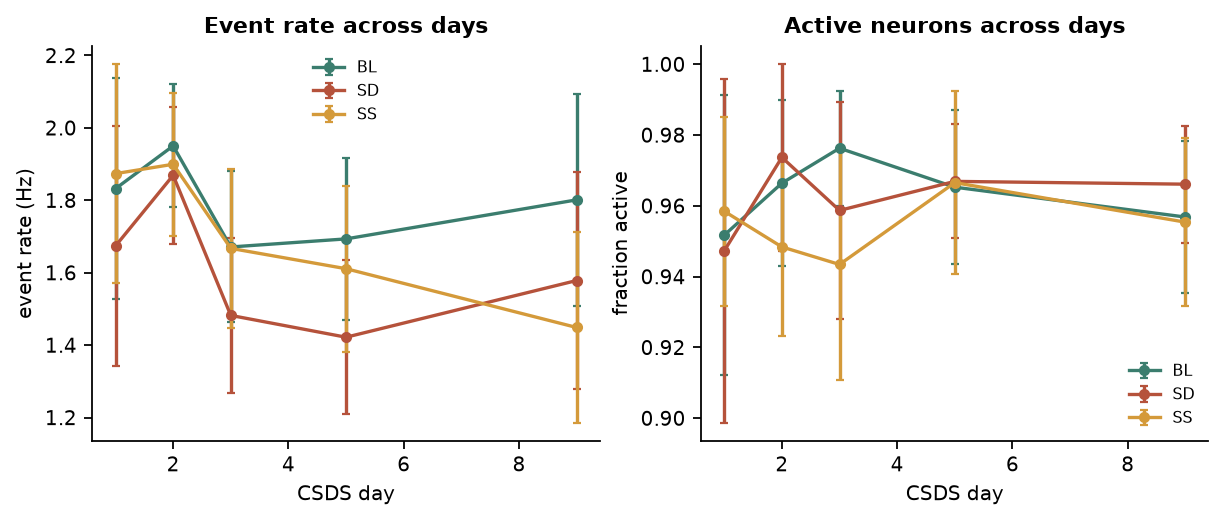
Across days. Day trends are reported in Table 3 (Figure 2). 0 of 6 trends survived FDR correction.
Behavior-locked responses. Figure 3 and Table 4 show the population z-score during each behavior. 0 of 12 behavior × context combinations differed from the session mean after FDR correction. At the population-average level, behavior did not consistently shift activity across animals. Single-neuron selectivity is examined in S03 and decoding in S08.
Figures
Tables
Table 1. Condition contrasts (per-animal means, days 1–9, day 7 excluded)
| metric | contrast | n | median_diff | dz | p | q_fdr | friedman_chi2 | friedman_p |
|---|---|---|---|---|---|---|---|---|
| rate_hz | SD vs BL | 6 | -0.224 | -1.07 | 0.0938 | 0.211 | 4 | 0.135 |
| rate_hz | SS vs BL | 6 | -0.0296 | -0.637 | 0.438 | 0.492 | 4 | 0.135 |
| rate_hz | SS vs SD | 6 | 0.179 | 1.24 | 0.0625 | 0.188 | 4 | 0.135 |
| active_fraction | SD vs BL | 6 | 0.00267 | -0.0185 | 1 | 1 | 0.636 | 0.727 |
| active_fraction | SS vs BL | 6 | -0.0138 | -0.303 | 0.438 | 0.492 | 0.636 | 0.727 |
| active_fraction | SS vs SD | 6 | -0.00749 | -0.574 | 0.312 | 0.469 | 0.636 | 0.727 |
| dff | SD vs BL | 6 | -0.119 | -1.52 | 0.0312 | 0.141 | 10.3 | 0.0057 |
| dff | SS vs BL | 6 | -0.0235 | -0.685 | 0.156 | 0.281 | 10.3 | 0.0057 |
| dff | SS vs SD | 6 | 0.0957 | 1.79 | 0.0312 | 0.141 | 10.3 | 0.0057 |
Table 2. Session-level OLS with animal × day fixed effects
| metric | term | coef | se | p_session | n_sessions |
|---|---|---|---|---|---|
| rate_hz | SD vs BL | -0.181 | 0.0372 | 9.79e-06 | 87 |
| rate_hz | SS vs BL | -0.0475 | 0.0372 | 0.207 | 87 |
| active_fraction | SD vs BL | -0.000566 | 0.00956 | 0.953 | 87 |
| active_fraction | SS vs BL | -0.00872 | 0.00956 | 0.365 | 87 |
| dff | SD vs BL | -0.161 | 0.0279 | 3.52e-07 | 87 |
| dff | SS vs BL | -0.0414 | 0.0279 | 0.143 | 87 |
Table 3. Day trends within condition
| metric | condition | slope_per_day | median_animal_slope | n_positive | n_animals | p | n_sessions | q_fdr |
|---|---|---|---|---|---|---|---|---|
| rate_hz | BL | -0.00922 | -0.0195 | 3 | 6 | 0.844 | 30 | 0.844 |
| rate_hz | SD | -0.0232 | -0.0419 | 1 | 6 | 0.438 | 30 | 0.525 |
| rate_hz | SS | -0.0548 | -0.0328 | 0 | 6 | 0.0312 | 29 | 0.188 |
| active_fraction | BL | -0.00037 | -0.00397 | 1 | 6 | 0.438 | 30 | 0.525 |
| active_fraction | SD | 0.00124 | -0.00294 | 1 | 6 | 0.438 | 30 | 0.525 |
| active_fraction | SS | 0.00187 | 0.00159 | 5 | 6 | 0.312 | 29 | 0.525 |
Table 4. Behavior-locked population rate
| group | behavior | n_animals | mean_z | p | q_fdr |
|---|---|---|---|---|---|
| BL+SS | Exploring | 6 | -0.0459 | 0.0625 | 0.562 |
| SD | Standing | 6 | 0.0316 | 0.0938 | 0.562 |
| SD | Exploring | 6 | -0.0665 | 0.156 | 0.625 |
| BL+SS | Grooming | 4 | 0.139 | 0.25 | 0.75 |
| SD | Submissive | 6 | -0.0588 | 0.312 | 0.75 |
| SD | Escape | 6 | -0.0638 | 0.562 | 0.825 |
| BL+SS | Standing | 6 | -0.00844 | 0.562 | 0.825 |
| BL+SS | Non-physical interaction | 6 | 0.0246 | 0.562 | 0.825 |
| SD | Freezing | 5 | -0.0355 | 0.625 | 0.825 |
| SD | Attack | 6 | 0.0248 | 0.688 | 0.825 |
| SD | Danger | 5 | 0.00527 | 0.812 | 0.844 |
| SD | Physical interaction | 6 | 0.0109 | 0.844 | 0.844 |
Table 5. Session-level activity
| key | subject | condition | day | mapping | rate_hz | active_fraction | dff |
|---|---|---|---|---|---|---|---|
| 4703_BL_D1 | 4703 | BL | 1 | supported | 1.75 | 0.952 | 1.29 |
| 4703_SD_D1 | 4703 | SD | 1 | supported | 1.79 | 1 | 0.871 |
| 4703_SS_D1 | 4703 | SS | 1 | supported | 1.9 | 1 | 0.972 |
| 4703_BL_D2 | 4703 | BL | 2 | supported | 1.85 | 0.971 | 1.22 |
| 4703_SD_D2 | 4703 | SD | 2 | supported | 2.09 | 1 | 1.02 |
| 4703_SS_D2 | 4703 | SS | 2 | supported | 1.86 | 1 | 1.16 |
| 4703_BL_D3 | 4703 | BL | 3 | supported | 1.73 | 0.952 | 1.08 |
| 4703_SD_D3 | 4703 | SD | 3 | supported | 1.85 | 0.952 | 0.856 |
| 4703_SS_D3 | 4703 | SS | 3 | supported | 1.77 | 1 | 0.89 |
| 4703_BL_D5 | 4703 | BL | 5 | supported | 1.41 | 1 | 0.538 |
| 4703_SD_D5 | 4703 | SD | 5 | supported | 1.57 | 1 | 0.42 |
| 4703_SS_D5 | 4703 | SS | 5 | supported | 1.49 | 1 | 0.541 |
| 4703_BL_D9 | 4703 | BL | 9 | supported | 1.87 | 0.857 | 1.01 |
| 4703_SD_D9 | 4703 | SD | 9 | supported | 1.65 | 0.914 | 0.961 |
| 4703_SS_D9 | 4703 | SS | 9 | supported | 1.77 | 0.914 | 0.99 |
Limitations
- Inferred spike rates depend on CASCADE model choice and noise level. Comparisons are within animal and within the same neurons, which limits but does not remove this dependence.
- With n = 6 the smallest attainable exact two-sided Wilcoxon p is 0.031. A null result is weak evidence of no effect.
- BL, SD and SS are always recorded in that order within a day. Condition contrasts are therefore confounded with position in the recording (photobleaching, within-day drift, time since handling).
- Slow fluorescence drift across the recording can mimic day trends. ΔF/F was computed on the concatenated recording (F₀ = 10th percentile in a 12-s window), so that window can cross an epoch boundary.
- The CASCADE model and noise level were not recorded. Spike probability is paired one-to-one with ΔF/F.
References
- Rupprecht P. et al. (2021) CASCADE spike inference. Nat Neurosci 24:1324–1337.
- CSDS decreases claustrum glutamatergic and prelimbic PV interneuron activity and increases prelimbic glutamatergic activity (2023) Nat Commun. doi:10.1038/s41467-023-43636-x
- Diminished social memory and hippocampal correlates of social interactions in chronic social defeat stress susceptibility (2025) Biol Psychiatry Glob Open Sci. https://www.bpsgos.org/article/S2667-1743(25)00009-6/fulltext
- Muir J. et al. (2018) In vivo fiber photometry reveals signature of future stress susceptibility in nucleus accumbens. Neuropsychopharmacology 43:255–263.
- de la Rocha J. et al. (2007) Correlation between neural spike trains increases with firing rate. Nature 448:802–806.
- Cohen M.R. & Kohn A. (2011) Measuring and interpreting neuronal correlations. Nat Neurosci 14:811–819.