Study S00 · generated 2026-10-13T21:06:11+00:00 · 80.1 s
Data provenance, quality control and session mapping
Recovering session boundaries from concatenated recordings and validating them against behavior.
Question
How are the calcium recordings organised in time, and can each imaging block be assigned to its behavioral session with evidence rather than assumption?
Background & rationale
Acquisition and preprocessing (as reported by the lab). Six male C57BL/6N mice (6–7 weeks at arrival) were imaged in prelimbic mPFC (AP +1.80 mm, ML +0.35 mm, DV −2.30 mm, no angle) with a Doric 2-color fluorescence miniscope (0.5 mm lens SICL_D_500_80) and AAV2/9-Syn-GCaMP6f. Frame rate is 6.666 frames/s. Imaging days are CSDS days 1, 2, 3, 5, 7 and 9, plus day 11. Each defeat day is a 15-min recording split into baseline (BL), social defeat (SD) and sensory stress (SS). Epoch length is nominally 2,000 frames and varies from 1,998 to 2,001. Raw frames (630 × 630 px) had black frames replaced by the mean of neighbouring frames and were spatially downsampled by a factor of 3 (210 × 210 px). Slow baseline drift in mean frame intensity was removed with a rubberband (convex-hull) baseline fitted by piecewise-linear and smoothing splines. Minian could not reliably detect neurons in the defeat data, so ROIs were drawn manually on a maximum projection after epochs were merged within each day and fields of view were checked across days, then aligned by hand across days: 848 neurons in total. ΔF/F was computed on the full concatenated recording (F₀ = 10th percentile in each 12-s window; the memoir approximated the frame rate as 7 Hz, about 84 frames). CASCADE converted each ΔF/F sample to a spike probability (Rupprecht et al. 2021; model and noise level not recorded). ANY-maze triggered the miniscope, so behavior and calcium start together. Annotation files of about 305 s (155 s for each SIT half) use a clock that is 5 s ahead of calcium time.
Why a QC study. The exported TS_{id}.xlsx workbooks hold one long neuron × frame matrix per animal with no
session markers. Every downstream contrast depends on assigning each ~2,000-frame block to the right session.
The lab's description fixes the order within a day, and this study verifies it from the data. Day 11
(BL → SIT → POST) is in the workbooks; the SIT block is two halves of about 1,000 frames (empty enclosure,
then CD-1) and was not used in the previous article.
Day 7 and incomplete epochs. Day 7 was not recorded for mouse 6597, and sensory stress on day 9 was not included for that mouse. Mouse 6669 has no SIT imaging block. Day-7 data exist for the other five mice. Primary analyses still omit day 7 so that every animal is compared on the same days.
Methodology
Data format. Each workbook holds two signal families, dff_mc (motion-corrected ΔF/F) and
predictions_dff_mc (inferred spike probability). Rows are neurons (row 0 is the frame index) and columns are
frames; time is split into part1/2/3 sheets only because Excel limits a sheet to 16,384 columns. Parts were
concatenated in order. The first and last 33 frames of each recording are constant. CASCADE was used only to
write the spike-probability columns, so those samples are excluded as unusable frames rather than as
documented CASCADE padding.
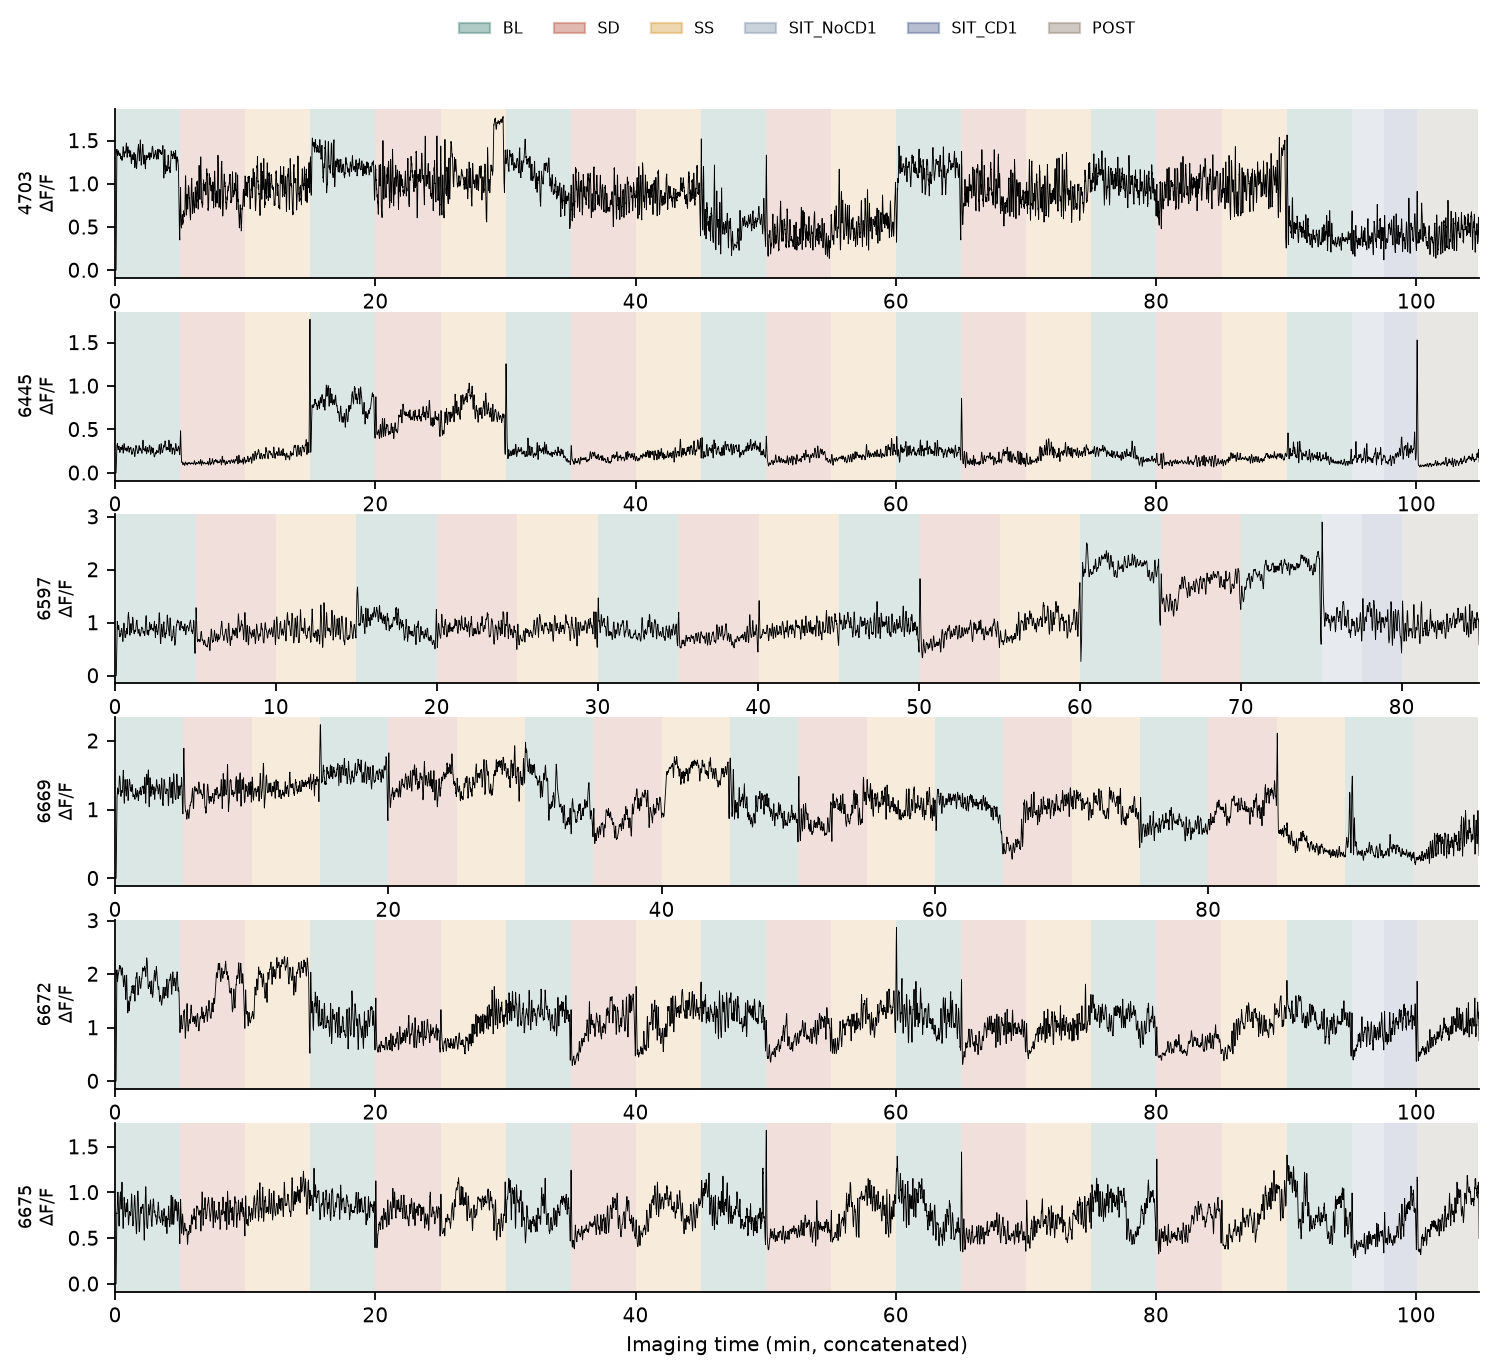
Block structure. Behavioral sessions last ≈300 s. Each SIT half lasts ≈150 s of calcium time inside one block (annotation files read ≈155 s because of the 5 s clock). We tested whether the recording is composed of fixed 2,000-frame blocks (300 s at 6.666 Hz). The lab reports that epoch length can be 1,998–2,001 frames, so a boundary can sit a few frames off this grid. For every candidate boundary t = 2,000·k, a boundary score was computed as the Euclidean distance between the population mean ΔF/F vectors in the 30 frames before and after t. This was compared with the same score at 400 random time points per animal, and each boundary is reported as a percentile of that null distribution. True session boundaries should sit in the upper tail, because focal plane, baseline fluorescence and behavioral context change between sessions. This test uses the nominal grid, so it is not biased by the correction below.
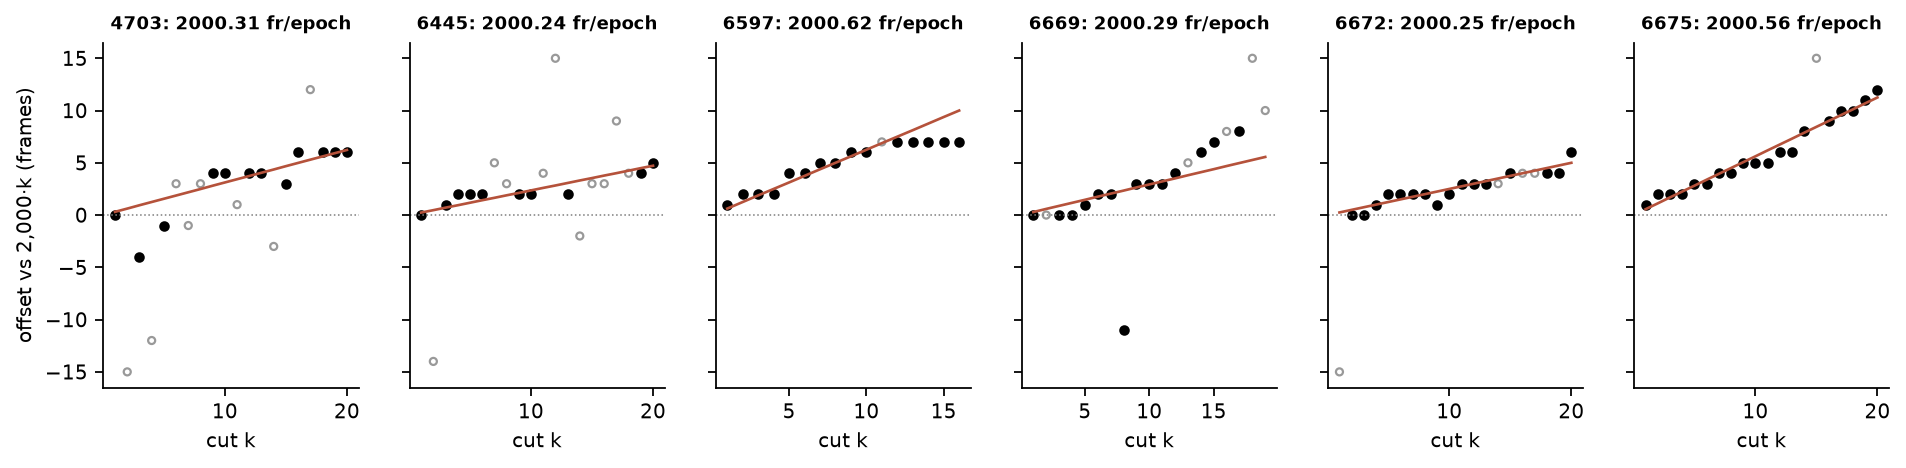
Epoch-length correction. Around each nominal cut k (frame 2,000·k), the step score (20 frames each side) was computed at every frame within ±15 frames. A step was reliable if it exceeded the 95th percentile of step scores at 400 random times and did not sit at the edge of the search window. Because offsets accumulate from frame 0, offset_k = k·δ, where δ is the mean deviation of epoch length from 2,000 frames. δ was estimated per animal as the median of offset_k / k over reliable cuts (≥ 4 required; otherwise δ = 0), limited to the lab's reported 1,998–2,001-frame range. All analyses cut epoch k at round(k·(2,000 + δ)). One parameter per animal is estimated, so individual noisy detections do not move individual boundaries.
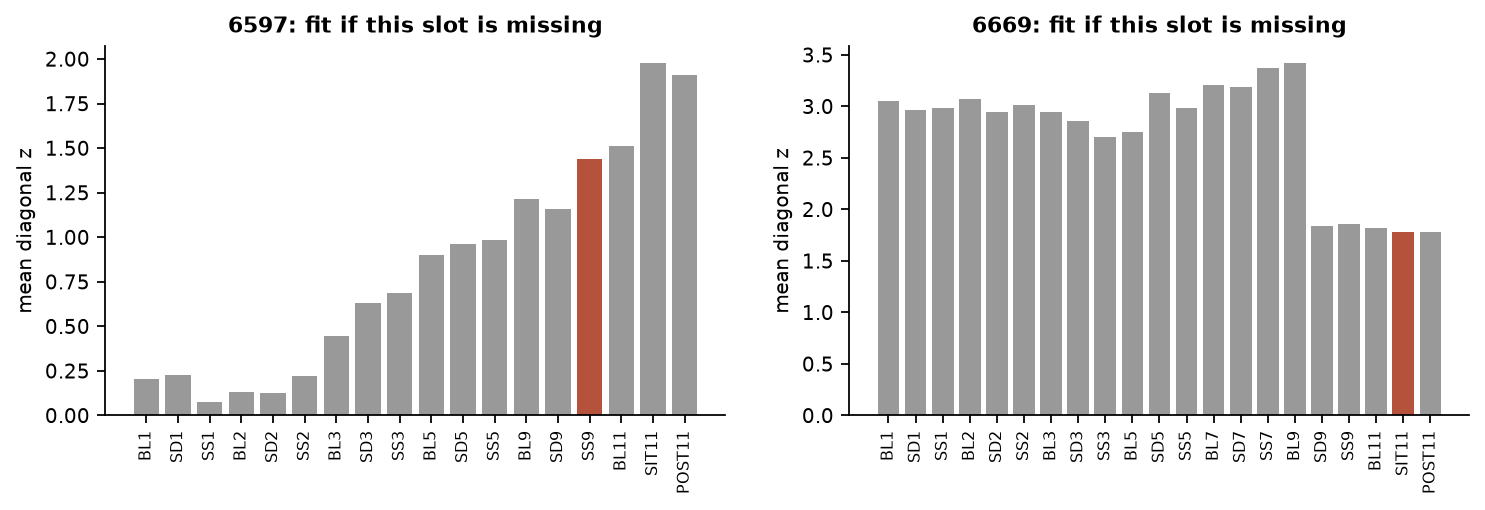
Session order hypothesis. The protocol implies, for each of days 1–9, BL → SD → SS. On day 11 it implies BL → SIT (empty enclosure, then CD1 target, ≈1,000 frames each) → POST. The lab identified the missing epoch for the two short recordings (6597: SS on day 9; 6669: SIT). Every single-slot deletion is still scored below as a check on that assignment.
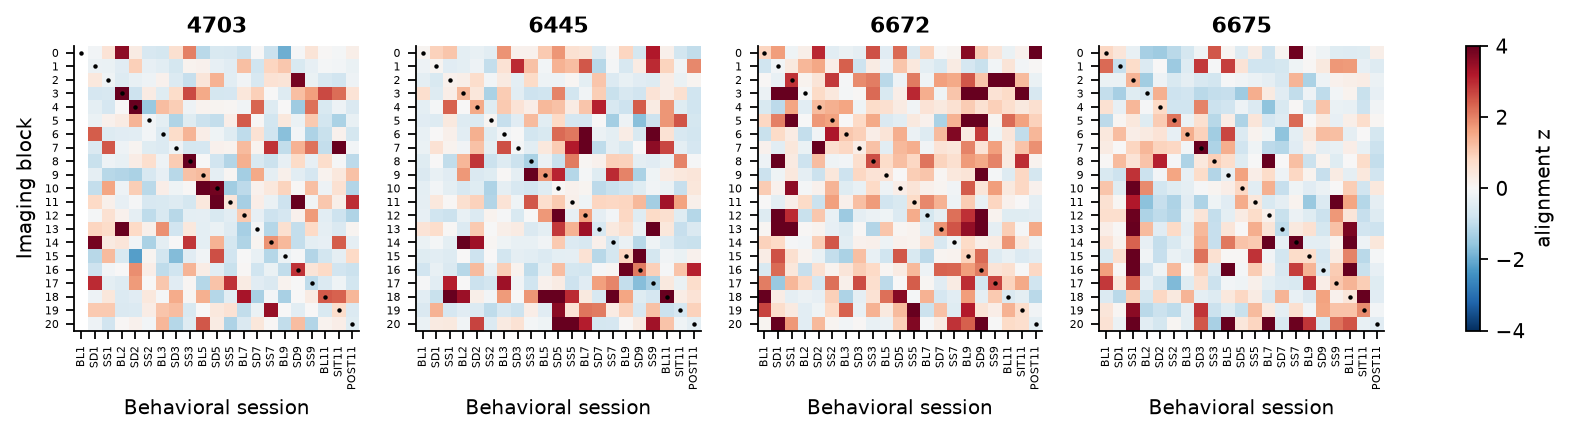
Behavior-encoding alignment test. If block b truly corresponds to session s, neural activity in b should be better explained by the ethogram of s than by the ethogram of any other session. For every (block, session) pair we: 1. Binned inferred spikes in 1-s bins and z-scored each neuron. 2. Assigned each bin the annotated behavior of the candidate session. 3. Computed η², the fraction of each neuron's variance explained by behavior labels, averaged over neurons. 4. Expressed η² as a z-score against 40 circular shifts of the label sequence, which preserves bout structure and destroys alignment.
The mean z on the hypothesised diagonal was compared with 5,000 random block→session permutations, per animal and pooled across animals with complete mappings. For animals with one block too few, the mean diagonal z was computed for each possible missing slot, giving a likelihood ranking of candidate mappings.
Frame-to-video timing. Calcium and behavior start together. Frame i of a block maps to annotation time i/6.666 s, plus 5 s when that file's duration is ≈305 s or ≈155 s.
Parameters
| Parameter | Value |
|---|---|
block_frames | 2000 |
fs_hz | 6.666 |
boundary_window | 30 |
alignment_bin_s | 1.0 |
alignment_null_shifts | 40 |
permutations | 5000 |
Highlights
info
Cohort
6 mice · 848 neurons
95–187 neurons per animal tracked across 126 mapped sessions (111 analysed after excluding day 7).
info
Epoch length
2000.24–2000.62 frames
Estimated from 86 reliable boundary steps. Correcting the fixed 2,000-frame grid shifts late cuts by up to 11 frames (1.7 s).
significant
Session boundaries
65% of boundaries > 90th pct
Population activity changes abruptly every 2,000 frames (binomial vs 10% chance, p < 0.001).
significant
Session order validated
pooled p < 0.001
Neural blocks are better explained by their own session's ethogram than by shuffled assignments (mean diagonal z = 0.96, 4 animals).
info
Missing epochs
6597 SS9, 6669 SIT11
Identified by the lab and omitted from the session map. Figure 4 ranks every other single-slot deletion as a check.
Results
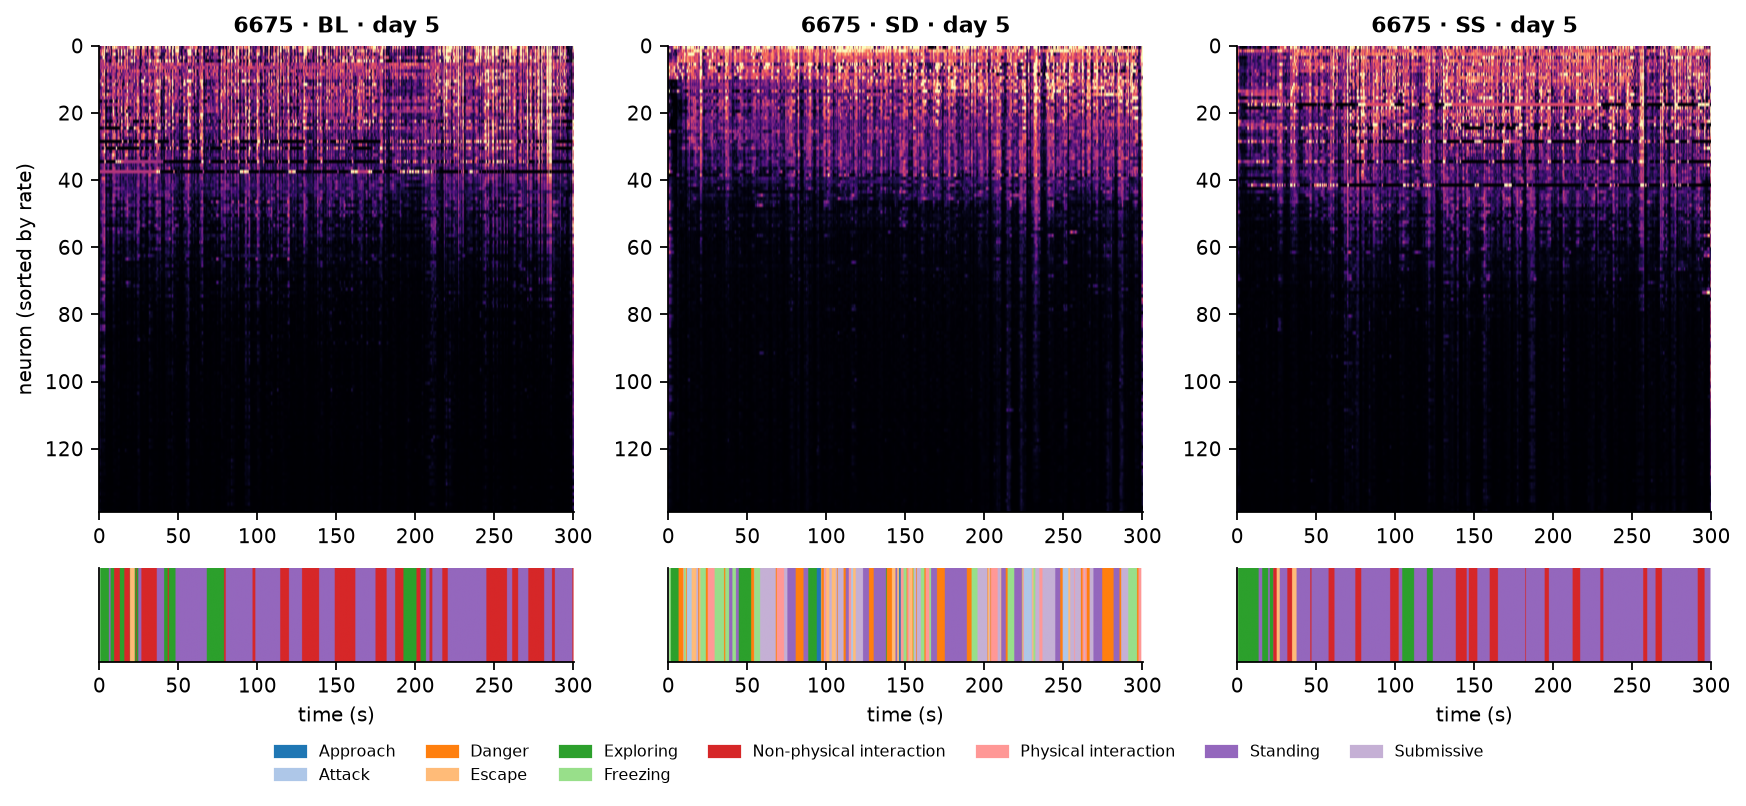
Recording structure. The 6 animals contributed 848 neurons in total (95–187 per animal), each tracked continuously for 84.8–104.8 min of imaging. Recordings split into ≈2,000-frame blocks. 65% of nominal block edges exceeded the 90th percentile of random-time boundary scores (expected 10%; binomial p < 0.001). Figure 1 shows the abrupt population-level steps at block edges.
Epoch length. Reliable boundary steps (86 of 115 cuts) sat progressively later than the 2,000-frame grid, which means epochs are slightly longer than 2,000 frames. The estimated length was 2000.24–2000.62 frames per animal, inside the lab's reported 1,998–2,001 range (Table 2, Figure 2). The median absolute residual of detected cuts around the drift model was 0.5 frames. Using the corrected cuts moves the last session boundary by up to 11 frames (1.7 s), which would otherwise misalign late sessions with their behavior annotations. The final epoch of every recording is short (1914–1923 frames), consistent with a truncated last epoch.
Session order. Under the protocol order (BL → SD → SS on days 1–9; BL → SIT → POST on day 11), the behavior-encoding alignment z on the hypothesised diagonal averaged 0.96 across the 4 animals with complete mappings, versus 0.45 for 5,000 random block assignments (pooled permutation p < 0.001; per-animal values in Table 4, Figure 3). Individually significant animals: 4703, 6675. Not individually significant: 6672, 6445.
Incomplete recordings. The lab identified the missing epochs: mouse 6597 has no day-7 recording and no sensory-stress block on day 9; mouse 6669 has no SIT imaging block. Alignment rankings of single-slot deletions were 6597: SIT11 (1.98), POST11 (1.91), BL11 (1.51), SS9 (1.44); 6669: BL9 (3.42), SS7 (3.37), BL7 (3.21), SD7 (3.19). Deleting an early slot fits clearly worse (Figure 4). The map uses the lab's assignment, not the top-scoring candidate.
Figures
Tables
Table 1. Recording summary per animal
| subject | neurons | frames | minutes | blocks | protocol_slots | sessions_mapped | mapping |
|---|---|---|---|---|---|---|---|
| 4703 | 105 | 41922 | 105 | 21 | 21 | 22 | supported |
| 6445 | 95 | 41922 | 105 | 21 | 21 | 22 | supported |
| 6597 | 156 | 33924 | 84.8 | 17 | 18 | 18 | supported |
| 6669 | 187 | 39929 | 99.8 | 20 | 21 | 20 | supported |
| 6672 | 166 | 41924 | 105 | 21 | 21 | 22 | supported |
| 6675 | 139 | 41929 | 105 | 21 | 21 | 22 | supported |
Table 2. Estimated epoch length per animal
| subject | cuts | reliable_cuts | epoch_frames | max_shift_vs_fixed_grid | median_abs_residual | last_epoch_frames |
|---|---|---|---|---|---|---|
| 4703 | 20 | 12 | 2e+03 | 6 | 0.636 | 1916 |
| 6445 | 20 | 10 | 2e+03 | 5 | 0.424 | 1917 |
| 6597 | 16 | 15 | 2e+03 | 10 | 0.5 | 1914 |
| 6669 | 19 | 14 | 2e+03 | 6 | 0.475 | 1923 |
| 6672 | 20 | 16 | 2e+03 | 5 | 0.5 | 1919 |
| 6675 | 20 | 19 | 2e+03 | 11 | 0.375 | 1918 |
Table 3. Detected boundary offsets
| subject | cut | offset | score | reliable | predicted_offset |
|---|---|---|---|---|---|
| 4703 | 1 | 0 | 16.2 | True | 0.31 |
| 4703 | 2 | -15 | 7.84 | False | 0.62 |
| 4703 | 3 | -4 | 14.4 | True | 0.94 |
| 4703 | 4 | -12 | 9.86 | False | 1.25 |
| 4703 | 5 | -1 | 18.7 | True | 1.56 |
| 4703 | 6 | 3 | 8.97 | False | 1.87 |
| 4703 | 7 | -1 | 8.68 | False | 2.18 |
| 4703 | 8 | 3 | 5.16 | False | 2.49 |
| 4703 | 9 | 4 | 23.3 | True | 2.81 |
| 4703 | 10 | 4 | 23.5 | True | 3.12 |
| 4703 | 11 | 1 | 8.59 | False | 3.43 |
| 4703 | 12 | 4 | 16.6 | True | 3.74 |
| 4703 | 13 | 4 | 25.8 | True | 4.05 |
| 4703 | 14 | -3 | 7.04 | False | 4.36 |
| 4703 | 15 | 3 | 15.5 | True | 4.68 |
| 4703 | 16 | 6 | 14 | True | 4.99 |
| 4703 | 17 | 12 | 10.1 | False | 5.3 |
| 4703 | 18 | 6 | 28.2 | True | 5.61 |
| 4703 | 19 | 6 | 15.3 | True | 5.92 |
| 4703 | 20 | 6 | 19.3 | True | 6.23 |
Table 4. Behavior-encoding alignment (complete mappings)
| subject | diagonal_z | shuffled_z_mean | p_perm |
|---|---|---|---|
| 4703 | 1.63 | 0.179 | 0.0004 |
| 6445 | 0.438 | 0.433 | 0.428 |
| 6672 | 0.873 | 0.836 | 0.421 |
| 6675 | 0.892 | 0.327 | 0.0254 |
Table 5. Candidate missing sessions (animals with one block too few)
| subject | missing_slot | diagonal_z |
|---|---|---|
| 6597 | SIT11 | 1.98 |
| 6597 | POST11 | 1.91 |
| 6597 | BL11 | 1.51 |
| 6597 | SS9 | 1.44 |
| 6597 | BL9 | 1.22 |
| 6597 | SD9 | 1.16 |
| 6597 | SS5 | 0.986 |
| 6597 | SD5 | 0.962 |
| 6597 | BL5 | 0.899 |
| 6597 | SS3 | 0.685 |
| 6597 | SD3 | 0.633 |
| 6597 | BL3 | 0.444 |
Table 6. Session map used by all studies
| subject | condition | day | block | start | stop | n_frames | obs_id | mapping | included |
|---|---|---|---|---|---|---|---|---|---|
| 4703 | BL | 1 | 0 | 33 | 2000 | 1967 | 4703_BL_Day1_08-05-23 | supported | True |
| 4703 | SD | 1 | 1 | 2000 | 4001 | 2001 | 4703_SD_Day1_08-05-23 | supported | True |
| 4703 | SS | 1 | 2 | 4001 | 6001 | 2000 | 4703_SS_Day1_08-05-23 | supported | True |
| 4703 | BL | 2 | 3 | 6001 | 8001 | 2000 | 4703_BL_Day2_09-05-23 | supported | True |
| 4703 | SD | 2 | 4 | 8001 | 10002 | 2001 | 4703_SD_Day2_09-05-23 | supported | True |
| 4703 | SS | 2 | 5 | 10002 | 12002 | 2000 | 4703_SS_Day2_09-05-23 | supported | True |
| 4703 | BL | 3 | 6 | 12002 | 14002 | 2000 | 4703_BL_Day3_10-05-23 | supported | True |
| 4703 | SD | 3 | 7 | 14002 | 16002 | 2000 | 4703_SD_Day3_10-05-23 | supported | True |
| 4703 | SS | 3 | 8 | 16002 | 18003 | 2001 | 4703_SS_Day3_10-05-23 | supported | True |
| 4703 | BL | 5 | 9 | 18003 | 20003 | 2000 | 4703_BL_Day5_12-05-23 | supported | True |
| 4703 | SD | 5 | 10 | 20003 | 22003 | 2000 | 4703_SD_Day5_12-05-23 | supported | True |
| 4703 | SS | 5 | 11 | 22003 | 24004 | 2001 | 4703_SS_Day5_12-05-23 | supported | True |
| 4703 | BL | 7 | 12 | 24004 | 26004 | 2000 | 4703_BL_Day7_14-05-23 | supported | False |
| 4703 | SD | 7 | 13 | 26004 | 28004 | 2000 | 4703_SD_Day7_14-05-23 | supported | False |
| 4703 | SS | 7 | 14 | 28004 | 30005 | 2001 | 4703_SS_Day7_14-05-23 | supported | False |
| 4703 | BL | 9 | 15 | 30005 | 32005 | 2000 | 4703_BL_Day9_16-05-23 | supported | True |
| 4703 | SD | 9 | 16 | 32005 | 34005 | 2000 | 4703_SD_Day9_16-05-23 | supported | True |
| 4703 | SS | 9 | 17 | 34005 | 36006 | 2001 | 4703_SS_Day9_16-05-23 | supported | True |
| 4703 | BL | 11 | 18 | 36006 | 38006 | 2000 | 4703_BL_Day11_18-05-23 | supported | True |
| 4703 | SIT_NoCD1 | 11 | 19 | 38006 | 39006 | 1000 | 4703_SIT_NoCD1_Day11_18-05-23 | supported | True |
| 4703 | SIT_CD1 | 11 | 19 | 39006 | 40006 | 1000 | 4703_SIT_CD1_Day11_18-05-23 | supported | True |
| 4703 | POST | 11 | 20 | 40006 | 41889 | 1883 | 4703_POST_SIT_Day11_18-05-23 | supported | True |
| 6445 | BL | 1 | 0 | 33 | 2000 | 1967 | 6445_BL_Day1_04-03-24 | supported | True |
| 6445 | SD | 1 | 1 | 2000 | 4000 | 2000 | 6445_SD_Day1_04-03-24 | supported | True |
| 6445 | SS | 1 | 2 | 4000 | 6001 | 2001 | 6445_SS_Day1_04-03-24 | supported | True |
| 6445 | BL | 2 | 3 | 6001 | 8001 | 2000 | 6445_BL_Day2_05-03-24 | supported | True |
| 6445 | SD | 2 | 4 | 8001 | 10001 | 2000 | 6445_SD_Day2_05-03-24 | supported | True |
| 6445 | SS | 2 | 5 | 10001 | 12001 | 2000 | 6445_SS_Day2_05-03-24 | supported | True |
| 6445 | BL | 3 | 6 | 12001 | 14002 | 2001 | 6445_BL_Day3_06-03-24 | supported | True |
| 6445 | SD | 3 | 7 | 14002 | 16002 | 2000 | 6445_SD_Day3_06-03-24 | supported | True |
Limitations
- The drift model assumes a constant mean epoch length per animal. Individual epochs vary by 1–2 frames (≈ 0.2 s) around it, which the model does not recover.
- ΔF/F baselines were estimated on the concatenated recording, so the 12-s F₀ window can cross an epoch boundary.
- The 33 constant frames at each end of a workbook are excluded. Their origin is not documented.
- CASCADE model and noise level were not recorded. Spike probability is paired one-to-one with ΔF/F.
- Mouse 6597 has no day-9 sensory-stress block, and mouse 6669 has no SIT imaging block.
References
- Rupprecht P. et al. (2021) A database and deep learning toolbox for noise-optimized, generalized spike inference from calcium imaging. Nat Neurosci 24:1324–1337.
- Dong Z. et al. (2022) Minian, an open-source miniscope analysis pipeline. eLife 11:e70661.
- Optimal choice of baseline correction for multivariate calibration of spectra (rubberband baseline method; cited by the lab).
- Golden S.A. et al. (2011) A standardized protocol for repeated social defeat stress in mice. Nat Protoc 6:1183–1191.