Study S01 · generated 2026-10-13T21:06:12+00:00 · 1.3 s
Behavioral phenotyping across chronic social defeat
Time budgets, the evolution of defeat responses across days, and a social-interaction phenotype.
Question
How does behavior evolve across repeated defeat, and how does social-test behavior relate to the lab's susceptible/resilient classification?
Background & rationale
In the CSDS paradigm, C57BL/6 mice are defeated daily by a novel CD-1 aggressor and then housed in sensory contact across a perforated divider (Golden et al. 2011). Susceptibility is classically defined in the social interaction test (SIT) by a social-interaction ratio below 1: time near a CD-1 target divided by time near an empty enclosure (Krishnan et al. 2007). Defeat episodes are characterised by attacks, submissive postures, freezing and escape. How these responses change across days is itself informative about coping strategy (Hollis & Kabbaj 2014). Here the ethograms are hand-scored state annotations (BORIS-style) for every session.
Methodology
Annotations. State events (start/stop, seconds) were loaded for every session. Labels were canonicalised:
standing→Standing, exploring→Exploring, grooming→Grooming, escape/huir→Escape. Observation IDs encode
animal, condition (BL, SD, SS, SIT_NoCD1, SIT_CD1, POST_SIT), CSDS day and date.
Time budgets. For each session, the time in each behavior was divided by total annotated time. Budgets were averaged per animal within condition, then across animals.
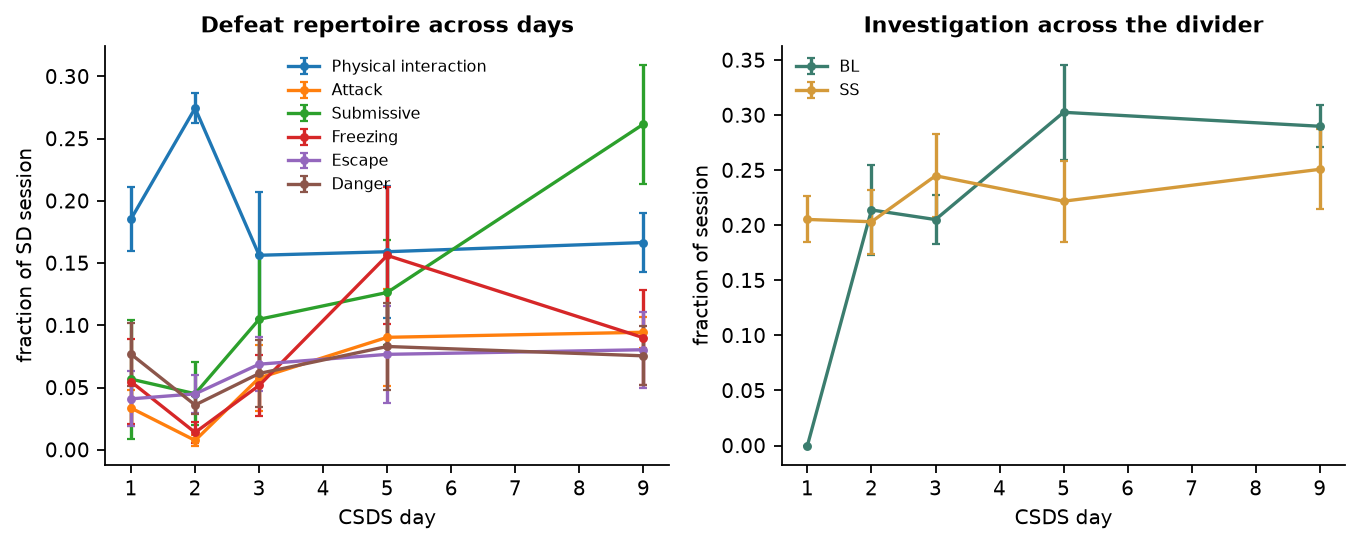
Defeat dynamics. Within SD sessions (days 1–9 without day 7), the fraction of time spent in each defeat-related state
(physical interaction, attack, submissive, freezing, escape, danger) was regressed on CSDS day separately for
each animal. The animal is the unit of inference: the six per-animal slopes were tested against 0 with an exact
two-sided Wilcoxon signed-rank test (summary-statistic random-effects approach; Holmes & Friston 1998). The
reported slope is the pooled within-animal estimate from fraction ~ day + animal (OLS with animal fixed
effects). The same analysis was applied to non-physical interaction in BL and SS sessions, i.e. time spent
investigating the aggressor across the divider. A decline would indicate emerging social avoidance. P-values
were FDR-corrected (Benjamini–Hochberg) across all trend tests. With six animals, the smallest attainable
two-sided p is 0.031.
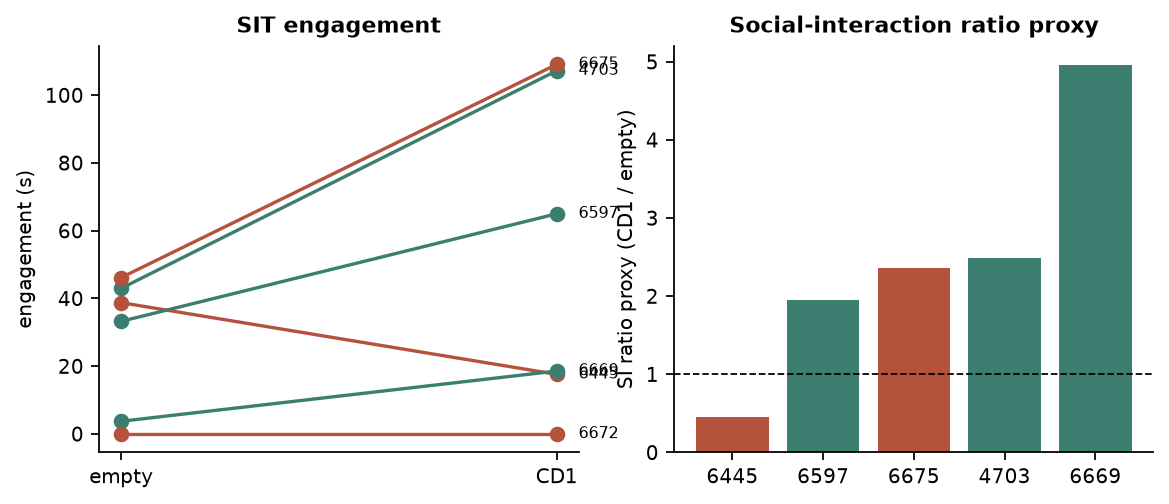
SIT phenotype. The susceptible/resilient label of each animal was provided by the lab. To check how much of it is visible in the annotations, social engagement was quantified as the seconds annotated as Interaction or Approach in each SIT phase (≈150 s each). The social-interaction ratio proxy is SI = engagement(CD1) / engagement(empty), and animals with SI < 1 are labelled susceptible-like. This is a proxy: the canonical ratio uses tracked time in an interaction zone, which is not available in these files.
Parameters
| Parameter | Value |
|---|---|
sit_engagement_states | ['Interaction', 'Approach'] |
defeat_states | ['Physical interaction', 'Attack', 'Submissive', 'Freezing', 'Escape', 'Danger'] |
Highlights
trend
Attack (SD)
+0.97 %/day
Change in time fraction per CSDS day; 6/6 animals positive, exact Wilcoxon p = 0.031 (q = 0.083).
trend
Submissive (SD)
+2.67 %/day
Change in time fraction per CSDS day; 6/6 animals positive, exact Wilcoxon p = 0.031 (q = 0.083).
trend
Non-physical interaction (BL)
+2.80 %/day
Change in time fraction per CSDS day; 6/6 animals positive, exact Wilcoxon p = 0.031 (q = 0.083).
info
Lab phenotype
3 susceptible · 3 resilient
Classification provided by the lab; used for all phenotype analyses (S10).
caution
Ethogram SI proxy vs lab phenotype
4/6 agree
1/6 animals have an annotation-based SI ratio < 1. The proxy does not reproduce the lab classification well and is not used to label animals.
Results
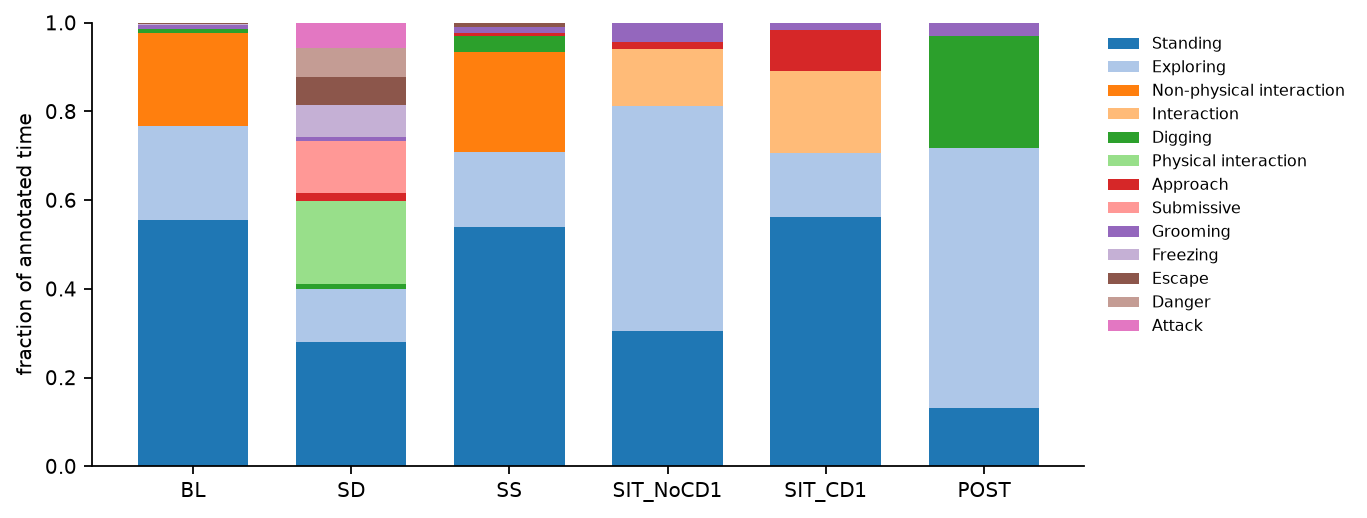
Time budgets. The three dominant states were standing 56%, exploring 21%, non-physical interaction 21% in baseline sessions and standing 54%, non-physical interaction 23%, exploring 17% in post-defeat sensory-contact sessions. Defeat sessions carried a large defeat repertoire: physical interaction 19%, submissive 12%, freezing 7%, escape 6% and attack 6% of annotated time (Figure 1).
Defeat dynamics. 0 of 8 day-trend tests survived FDR correction. The strongest effects are listed in Table 1 and plotted in Figure 2. Positive slopes mean the behavior occupies more of each session as defeats accumulate.
SIT phenotype. The lab classified 4703, 6597 and 6669 as resilient and 6445, 6672 and 6675 as susceptible. An annotation-based proxy (Interaction + Approach time with the CD-1 vs the empty enclosure) gave SI ratios of 0.45–4.96, with 1 of 6 animals below 1. The proxy matched the lab classification for 4 of 6 animals (Table 2, Figure 3). Ethogram states are not a substitute for zone-based tracking, so the lab classification is used for all phenotype analyses (S10).
Figures
Tables
Table 1. Change in behavior across CSDS days
| behavior | condition | slope_per_day | median_animal_slope | n_positive | n_animals | p | n_sessions | q_fdr |
|---|---|---|---|---|---|---|---|---|
| Physical interaction | SD | -0.00675 | -0.00749 | 2 | 6 | 0.312 | 30 | 0.417 |
| Attack | SD | 0.00973 | 0.0107 | 6 | 6 | 0.0312 | 30 | 0.0833 |
| Submissive | SD | 0.0267 | 0.0257 | 6 | 6 | 0.0312 | 30 | 0.0833 |
| Freezing | SD | 0.00908 | 0.00413 | 5 | 6 | 0.0625 | 30 | 0.125 |
| Escape | SD | 0.00493 | 0.00171 | 4 | 6 | 0.312 | 30 | 0.417 |
| Danger | SD | 0.00242 | -0.000394 | 2 | 6 | 0.812 | 30 | 0.812 |
| Non-physical interaction | BL | 0.028 | 0.0268 | 6 | 6 | 0.0312 | 30 | 0.0833 |
| Non-physical interaction | SS | 0.00522 | 0.00192 | 3 | 6 | 0.562 | 30 | 0.643 |
Table 2. SIT engagement and social-interaction ratio proxy
| subject | CD1_engagement_s | empty_engagement_s | SI_ratio_proxy | phenotype_proxy | phenotype_lab | proxy_agrees | defeat_response_index |
|---|---|---|---|---|---|---|---|
| 4703 | 107 | 43 | 2.49 | resilient-like | resilient | True | 0.084 |
| 6445 | 17.6 | 38.8 | 0.454 | susceptible-like | susceptible | True | 0.178 |
| 6597 | 65 | 33.2 | 1.96 | resilient-like | resilient | True | 0.215 |
| 6669 | 18.6 | 3.75 | 4.96 | resilient-like | resilient | True | 0.297 |
| 6672 | 0 | 0 | resilient-like | susceptible | False | 0.433 | |
| 6675 | 109 | 46.2 | 2.36 | resilient-like | susceptible | False | 0.32 |
Table 3. Mean time budget per condition
| condition | Approach | Attack | Danger | Digging | Escape | Exploring | Freezing | Grooming | Interaction | Non-physical interaction | Physical interaction | Standing | Submissive |
|---|---|---|---|---|---|---|---|---|---|---|---|---|---|
| BL | 0.0007 | 0.0003 | 0.0001 | 0.008 | 0.0025 | 0.21 | 0.0023 | 0.0089 | 0 | 0.21 | 0.0001 | 0.556 | 0.0004 |
| SD | 0.0162 | 0.0567 | 0.0665 | 0.0114 | 0.0623 | 0.118 | 0.0733 | 0.0071 | 0 | 0.0007 | 0.188 | 0.281 | 0.119 |
| SS | 0.005 | 0 | 0.0005 | 0.037 | 0.0093 | 0.168 | 0.0001 | 0.0144 | 0 | 0.225 | 0 | 0.54 | 0 |
| SIT_NoCD1 | 0.0172 | 0 | 0 | 0 | 0 | 0.507 | 0 | 0.0427 | 0.128 | 0 | 0 | 0.305 | 0 |
| SIT_CD1 | 0.0923 | 0 | 0 | 0 | 0 | 0.145 | 0 | 0.0167 | 0.184 | 0 | 0 | 0.562 | 0 |
| POST | 0 | 0 | 0 | 0.253 | 0 | 0.586 | 0 | 0.0292 | 0 | 0 | 0 | 0.131 | 0 |
Limitations
- The SI ratio is derived from ethogram states, not zone tracking. The lab pointed to the interaction- and corner-zone times (Shared_CSDS); those scores are not in this repository. n = 6, with no non-defeated control group. Phenotype labels are descriptive and are not used as a grouping factor for inferential tests.
- "Attack" refers to the annotated attack state in the focal animal's ethogram. Whether it codes being attacked or retaliation should be confirmed with the scorer.
- Observer reliability (inter-rater agreement) is not available in these files.
References
- Golden S.A. et al. (2011) A standardized protocol for repeated social defeat stress in mice. Nat Protoc 6:1183–1191.
- Krishnan V. et al. (2007) Molecular adaptations underlying susceptibility and resistance to social defeat in brain reward regions. Cell 131:391–404.
- Hollis F. & Kabbaj M. (2014) Social defeat as an animal model for depression. ILAR J 55:221–232.
- Friard O. & Gamba M. (2016) BORIS: a free, versatile open-source event-logging software for video/audio coding and live observations. Methods Ecol Evol 7:1325–1330.
- Holmes A.P. & Friston K.J. (1998) Generalisability, random effects and population inference. NeuroImage 7:S754.