Study S06 · generated 2026-10-13T21:15:11+00:00 · 19.0 s
Network reorganisation and drift
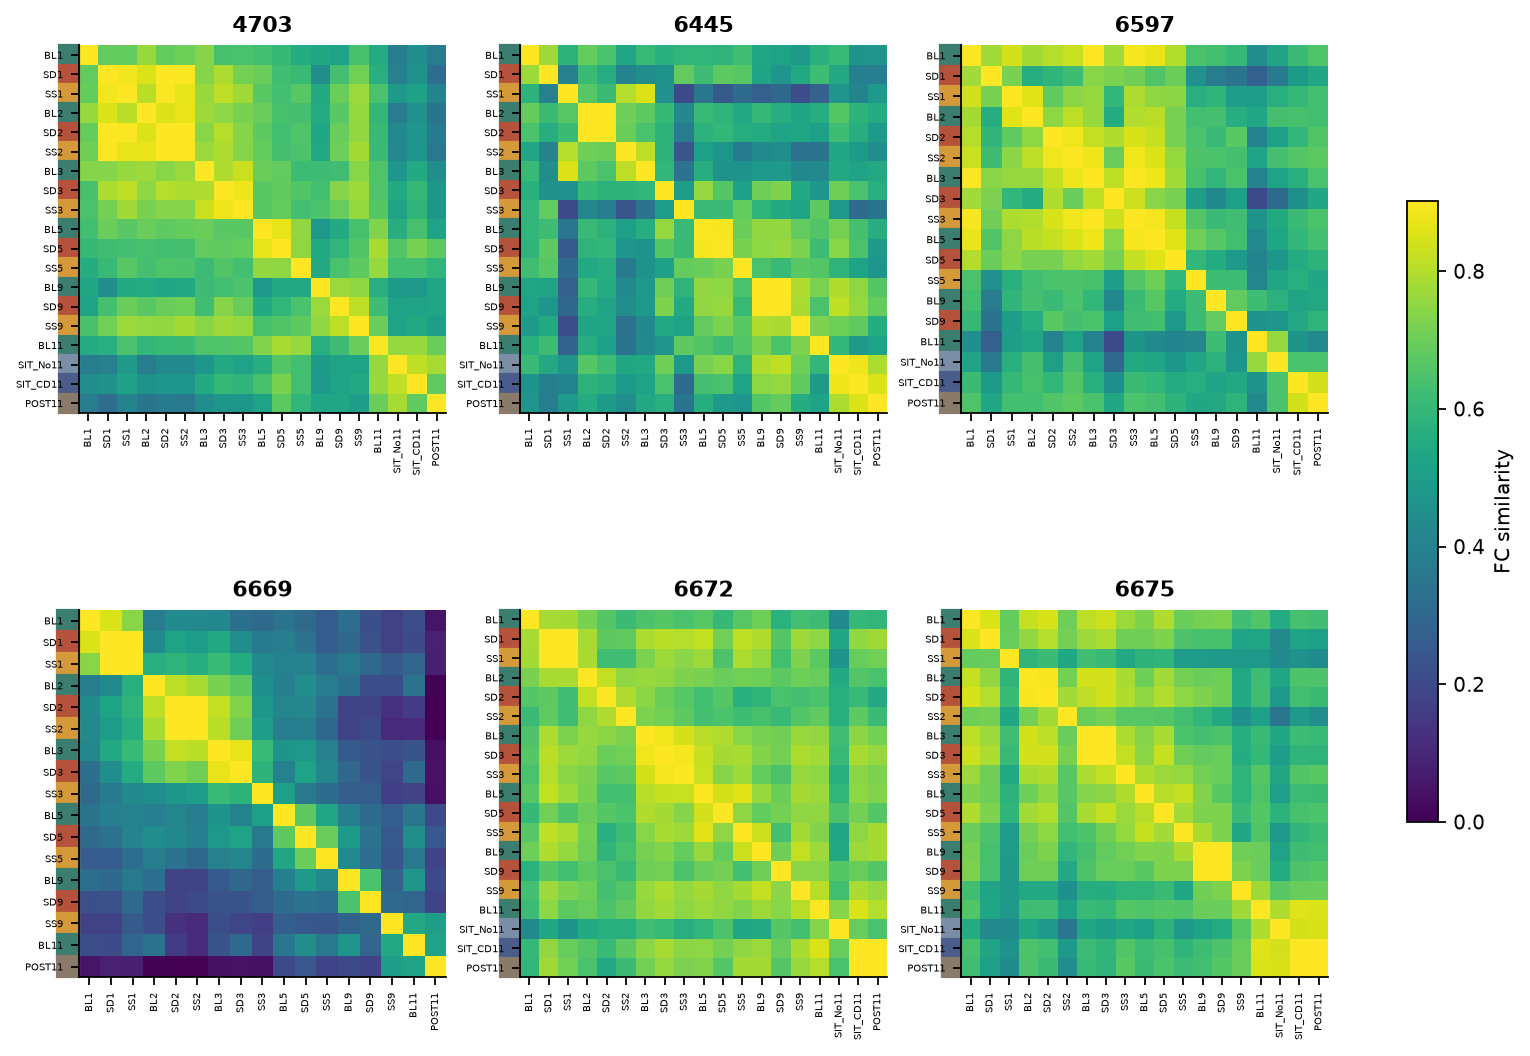
Similarity of neuron-level FC across all sessions: context-specific configurations vs slow drift.
Question
Does each CSDS context (baseline, defeat, sensory contact, SIT) evoke its own network configuration that recurs across days, and how quickly does the functional network drift over the 11 days?
Background & rationale
Comparing whole connectivity matrices across sessions, rather than summary statistics, captures which neurons are coupled. In longitudinal imaging, neural representations drift over days while preserving coarse structure (Ziv et al. 2013; Driscoll et al. 2017; Rule et al. 2019). Context-dependent reconfiguration of functional connectivity is well established in human network neuroscience (Cole et al. 2014; Bassett et al. 2011). For CSDS the question is whether defeat and sensory contact each impose a recurring network state, and whether that state bleeds into baseline sessions as stress accumulates.
Methodology
FC similarity. For every pair of sessions within an animal, similarity = Pearson correlation between the Fisher-z-transformed upper triangles of the two neuron × neuron FC matrices (inferred spikes). The same neurons are present in every session, so this compares the identity of coupled pairs, not just summary topology.
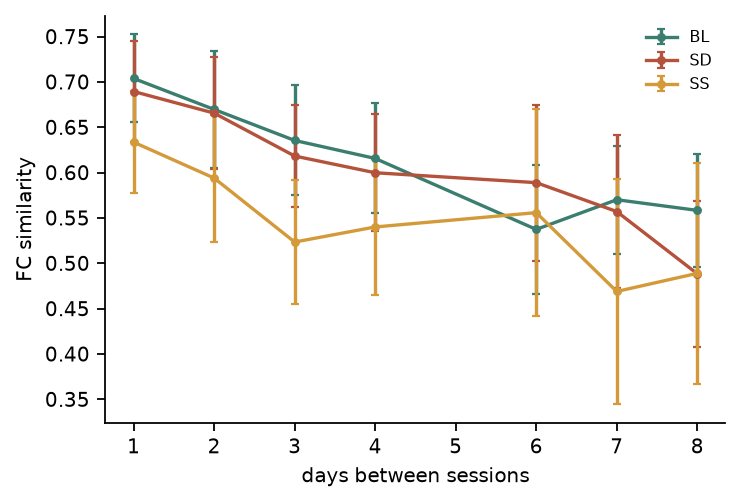
Drift. For pairs from the same condition (BL, SD or SS; days 1–9, day 7 excluded), similarity was modelled as a function of day lag, separately for each animal. Pairs share sessions and are therefore not independent, so inference uses one slope per animal (exact Wilcoxon signed-rank across animals, BH-FDR across the three contexts). A negative slope indicates progressive drift.
Same-day similarity. Different-context pairs recorded on the same day were compared with different-context pairs from different days (per-animal means, exact Wilcoxon).
Context specificity. All pairs from different days among BL/SD/SS (days 1–9 without day 7) were modelled as
similarity ~ same_condition + |lag| + animal. Restricting to different days removes the same-day confound
(shared focal plane and slow fluorescence state). The same_condition coefficient estimates how much more alike
two sessions are when they share a context. Significance was assessed by permuting condition labels within
day for each animal (1,000 permutations; statistic = same-context minus different-context similarity after
removing each animal's mean), which preserves the day structure. The per-animal mean difference
(same − different context) was also tested with an exact Wilcoxon test.
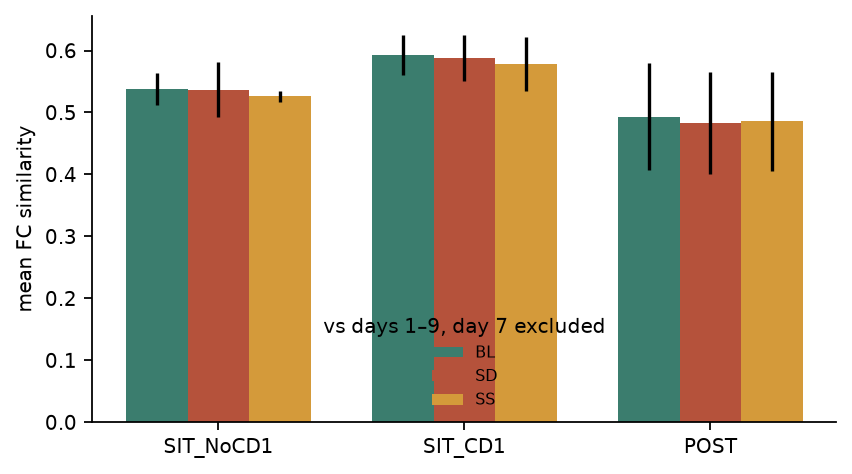
Day-11 sessions. The SIT (empty, CD-1) and post-SIT networks were compared with the mean BL, SD and SS networks of days 1–9, day 7 excluded, to ask whether the SIT evokes a defeat-like configuration (exact Wilcoxon, SD vs BL reference).
Embedding. Classical (Torgerson) MDS of 1 − similarity per animal, coloured by condition.
Parameters
| Parameter | Value |
|---|---|
similarity | Pearson r of Fisher-z FC upper triangles |
permutations | 1000 |
Highlights
null
Context-specific networks
Δsim = +0.005
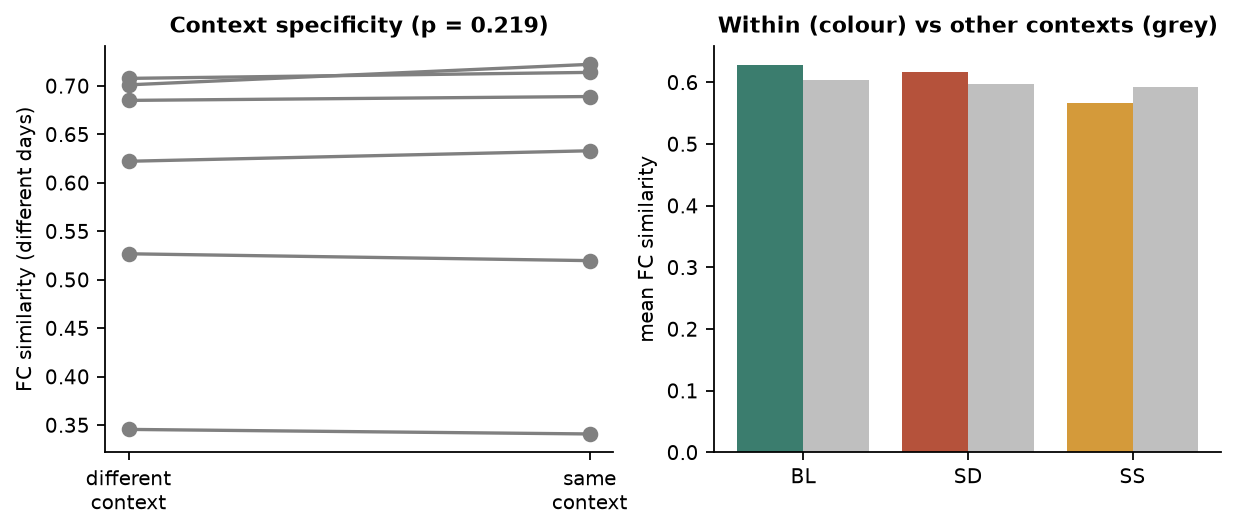
Sessions sharing a context are more alike than different-context sessions on other days (within-day permutation p = 0.126; Wilcoxon p = 0.219; OLS β = +0.005).
significant
Drift of defeat networks
-0.0249 per day
Mean per-animal change in FC similarity per day of separation between SD sessions; 6/6 animals negative, exact Wilcoxon p = 0.031, q = 0.047 (FDR over BL, SD, SS).
null
SIT network resembles…
no preference
SIT (CD-1) FC similarity to defeat 0.588 vs baseline 0.592, p = 1.000.
Results
Overall structure. Figure 1 shows session-by-session FC similarity. Different-context sessions recorded on the same day had a mean similarity of 0.738, against 0.598 for different-context sessions on different days (6/6 animals higher on the same day; exact Wilcoxon p = 0.031).
Drift. Same-context similarity changed with lag at BL -0.0227/day (p = 0.031, q = 0.047), SD -0.0249/day (p = 0.031, q = 0.047), SS -0.0264/day (p = 0.156, q = 0.156) (mean per-animal slope, exact Wilcoxon across animals; Table 1, Figure 2). Negative slopes indicate progressive reorganisation of which neurons are coupled. Elapsed time and accumulated defeat are confounded in this design, so drift cannot be attributed to stress alone.
Context specificity. Among different-day pairs, sessions sharing a context were more similar by +0.005 on average (4/6 animals positive; within-day label permutation p = 0.126; Wilcoxon p = 0.219). Per-context tests are in Table 2: BL: within 0.628 vs other 0.605 (p = 0.047); SD: within 0.616 vs other 0.597 (p = 0.078); SS: within 0.567 vs other 0.593 (p = 0.844).
Figures

Tables
Table 1. Drift of same-context networks across days
| condition | slope_per_day | n_negative | n_animals | p | similarity_lag_min | n_pairs | q_fdr |
|---|---|---|---|---|---|---|---|
| BL | -0.0227 | 6 | 6 | 0.0312 | 0.704 | 60 | 0.0469 |
| SD | -0.0249 | 6 | 6 | 0.0312 | 0.689 | 60 | 0.0469 |
| SS | -0.0264 | 4 | 6 | 0.156 | 0.633 | 56 | 0.156 |
Table 2. Within- vs between-context similarity (different days only)
| condition | within_context | to_other_contexts | p |
|---|---|---|---|
| BL | 0.628 | 0.605 | 0.0469 |
| SD | 0.616 | 0.597 | 0.0781 |
| SS | 0.567 | 0.593 | 0.844 |
Table 3. Context specificity per animal
| subject | different_context | same_context | specificity |
|---|---|---|---|
| 4703 | 0.701 | 0.722 | 0.0212 |
| 6445 | 0.527 | 0.52 | -0.00707 |
| 6597 | 0.622 | 0.633 | 0.0108 |
| 6669 | 0.346 | 0.341 | -0.0047 |
| 6672 | 0.708 | 0.714 | 0.00619 |
| 6675 | 0.685 | 0.689 | 0.00398 |
Table 4. Day-11 sessions vs days 1–9, day 7 excluded contexts
| subject | session | BL | SD | SS |
|---|---|---|---|---|
| 4703 | POST | 0.461 | 0.492 | 0.486 |
| 4703 | SIT_CD1 | 0.535 | 0.576 | 0.572 |
| 4703 | SIT_NoCD1 | 0.475 | 0.528 | 0.535 |
| 6445 | POST | 0.527 | 0.494 | 0.436 |
| 6445 | SIT_CD1 | 0.558 | 0.565 | 0.456 |
| 6445 | SIT_NoCD1 | 0.629 | 0.647 | 0.525 |
| 6597 | POST | 0.565 | 0.527 | 0.567 |
| 6597 | SIT_CD1 | 0.537 | 0.48 | 0.555 |
| 6597 | SIT_NoCD1 | 0.508 | 0.389 | 0.52 |
| 6669 | POST | 0.0905 | 0.0977 | 0.134 |
| 6672 | POST | 0.691 | 0.68 | 0.718 |
| 6672 | SIT_CD1 | 0.703 | 0.71 | 0.73 |
| 6672 | SIT_NoCD1 | 0.549 | 0.607 | 0.553 |
| 6675 | POST | 0.626 | 0.605 | 0.573 |
| 6675 | SIT_CD1 | 0.629 | 0.607 | 0.578 |
| 6675 | SIT_NoCD1 | 0.53 | 0.511 | 0.497 |
Table 5. All pairwise session similarities
| subject | a | b | cond_a | cond_b | day_a | day_b | similarity | lag | same_condition |
|---|---|---|---|---|---|---|---|---|---|
| 4703 | 4703_BL_D1 | 4703_SD_D1 | BL | SD | 1 | 1 | 0.712 | 0 | 0 |
| 4703 | 4703_BL_D1 | 4703_SS_D1 | BL | SS | 1 | 1 | 0.713 | 0 | 0 |
| 4703 | 4703_BL_D1 | 4703_BL_D2 | BL | BL | 1 | 2 | 0.792 | 1 | 1 |
| 4703 | 4703_BL_D1 | 4703_SD_D2 | BL | SD | 1 | 2 | 0.716 | 1 | 0 |
| 4703 | 4703_BL_D1 | 4703_SS_D2 | BL | SS | 1 | 2 | 0.731 | 1 | 0 |
| 4703 | 4703_BL_D1 | 4703_BL_D3 | BL | BL | 1 | 3 | 0.764 | 2 | 1 |
| 4703 | 4703_BL_D1 | 4703_SD_D3 | BL | SD | 1 | 3 | 0.662 | 2 | 0 |
| 4703 | 4703_BL_D1 | 4703_SS_D3 | BL | SS | 1 | 3 | 0.668 | 2 | 0 |
| 4703 | 4703_BL_D1 | 4703_BL_D5 | BL | BL | 1 | 5 | 0.653 | 4 | 1 |
| 4703 | 4703_BL_D1 | 4703_SD_D5 | BL | SD | 1 | 5 | 0.626 | 4 | 0 |
Limitations
- FC similarity is sensitive to session length and noise. BL/SD/SS sessions have equal length (≈2,000 frames), but SIT phases are ~1,000 frames and are shown descriptively only.
- Slow changes in imaging quality across days also produce apparent drift.
References
- Ziv Y. et al. (2013) Long-term dynamics of CA1 hippocampal place codes. Nat Neurosci 16:264–266.
- Driscoll L.N. et al. (2017) Dynamic reorganization of neuronal activity patterns in parietal cortex. Cell 170:986–999.
- Rule M.E., O'Leary T. & Harvey C.D. (2019) Causes and consequences of representational drift. Curr Opin Neurobiol 58:141–147.
- Cole M.W. et al. (2014) Intrinsic and task-evoked network architectures of the human brain. Neuron 83:238–251.
- Bassett D.S. et al. (2011) Dynamic reconfiguration of human brain networks during learning. PNAS 108:7641–7646.