Study S07 · generated 2026-10-13T21:16:33+00:00 · 81.7 s
Behavior-state-dependent networks
Functional networks computed separately within each annotated behavior, frame-count matched.
Question
Within the defeat context, does the network configuration depend on what the animal is doing (physical interaction, submission, freezing, escape vs exploration)?
Background & rationale
Population coupling is not fixed. Correlations between neurons change with behavioral state, arousal and locomotion (Vinck et al. 2015; Stringer et al. 2019). Behaviorally specific patterns of co-activity carry social information beyond single-neuron rates in prefrontal cortex (Frost et al. 2021). Amygdala ensembles encode behavioral states such as exploration and defensive behavior (Gründemann et al. 2019). Here we ask whether defensive states during defeat reconfigure the neuron-level network relative to non-social exploration.
Methodology
State frames. For each animal, frames from SD sessions (days 1–9 without day 7) were grouped by annotated state: physical interaction, submissive, freezing, escape, exploring and standing. States needed ≥ 200 frames (≈ 30 s). The same was done for BL + SS sessions (non-physical interaction, exploring, standing).
Frame-count matching. Correlation estimates and graph measures depend on sample size. For every animal, N = the smallest frame count among its eligible states. Each state was subsampled to N frames (random frames, 20 repeats), and FC and measures were averaged over repeats.
Measures. Mean pairwise correlation; and on 10%-density graphs: clustering, global efficiency and Louvain modularity.
State similarity (cross-validated). Recording days were split into alternating halves (odd vs even day rank), and each state's FC was estimated separately in each half from the same number of frames. Reliability of a state is the FC similarity (Pearson r between Fisher-z upper triangles, as in S06) between its odd-half and even-half networks. Cross-state similarity of states A and B is the mean of sim(A_odd, B_even) and sim(B_odd, A_even). Both quantities therefore compare independent sessions with equal sample sizes, so autocorrelation and estimation noise affect them equally. Cross-state similarity well below reliability means states reconfigure the network.
Statistics. Friedman test across states for animals with all states. Each state vs exploring was compared with exact Wilcoxon tests, FDR-corrected within context.
Parameters
| Parameter | Value |
|---|---|
min_frames | 200 |
repeats | 20 |
density | 0.1 |
Highlights
null
Submissive: modularity vs exploring
-0.124
Defeat context, 5 animals, p = 0.188, q = 1.000.
null
States reconfigure the network
0.57 vs 0.57
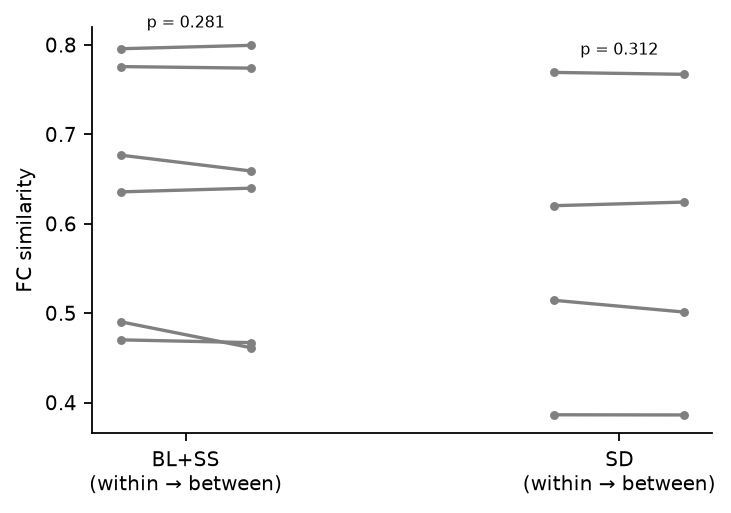
Cross-validated (odd vs even days) within-state reliability vs between-state FC similarity, defeat context, 3/4 animals, p = 0.312.
Results
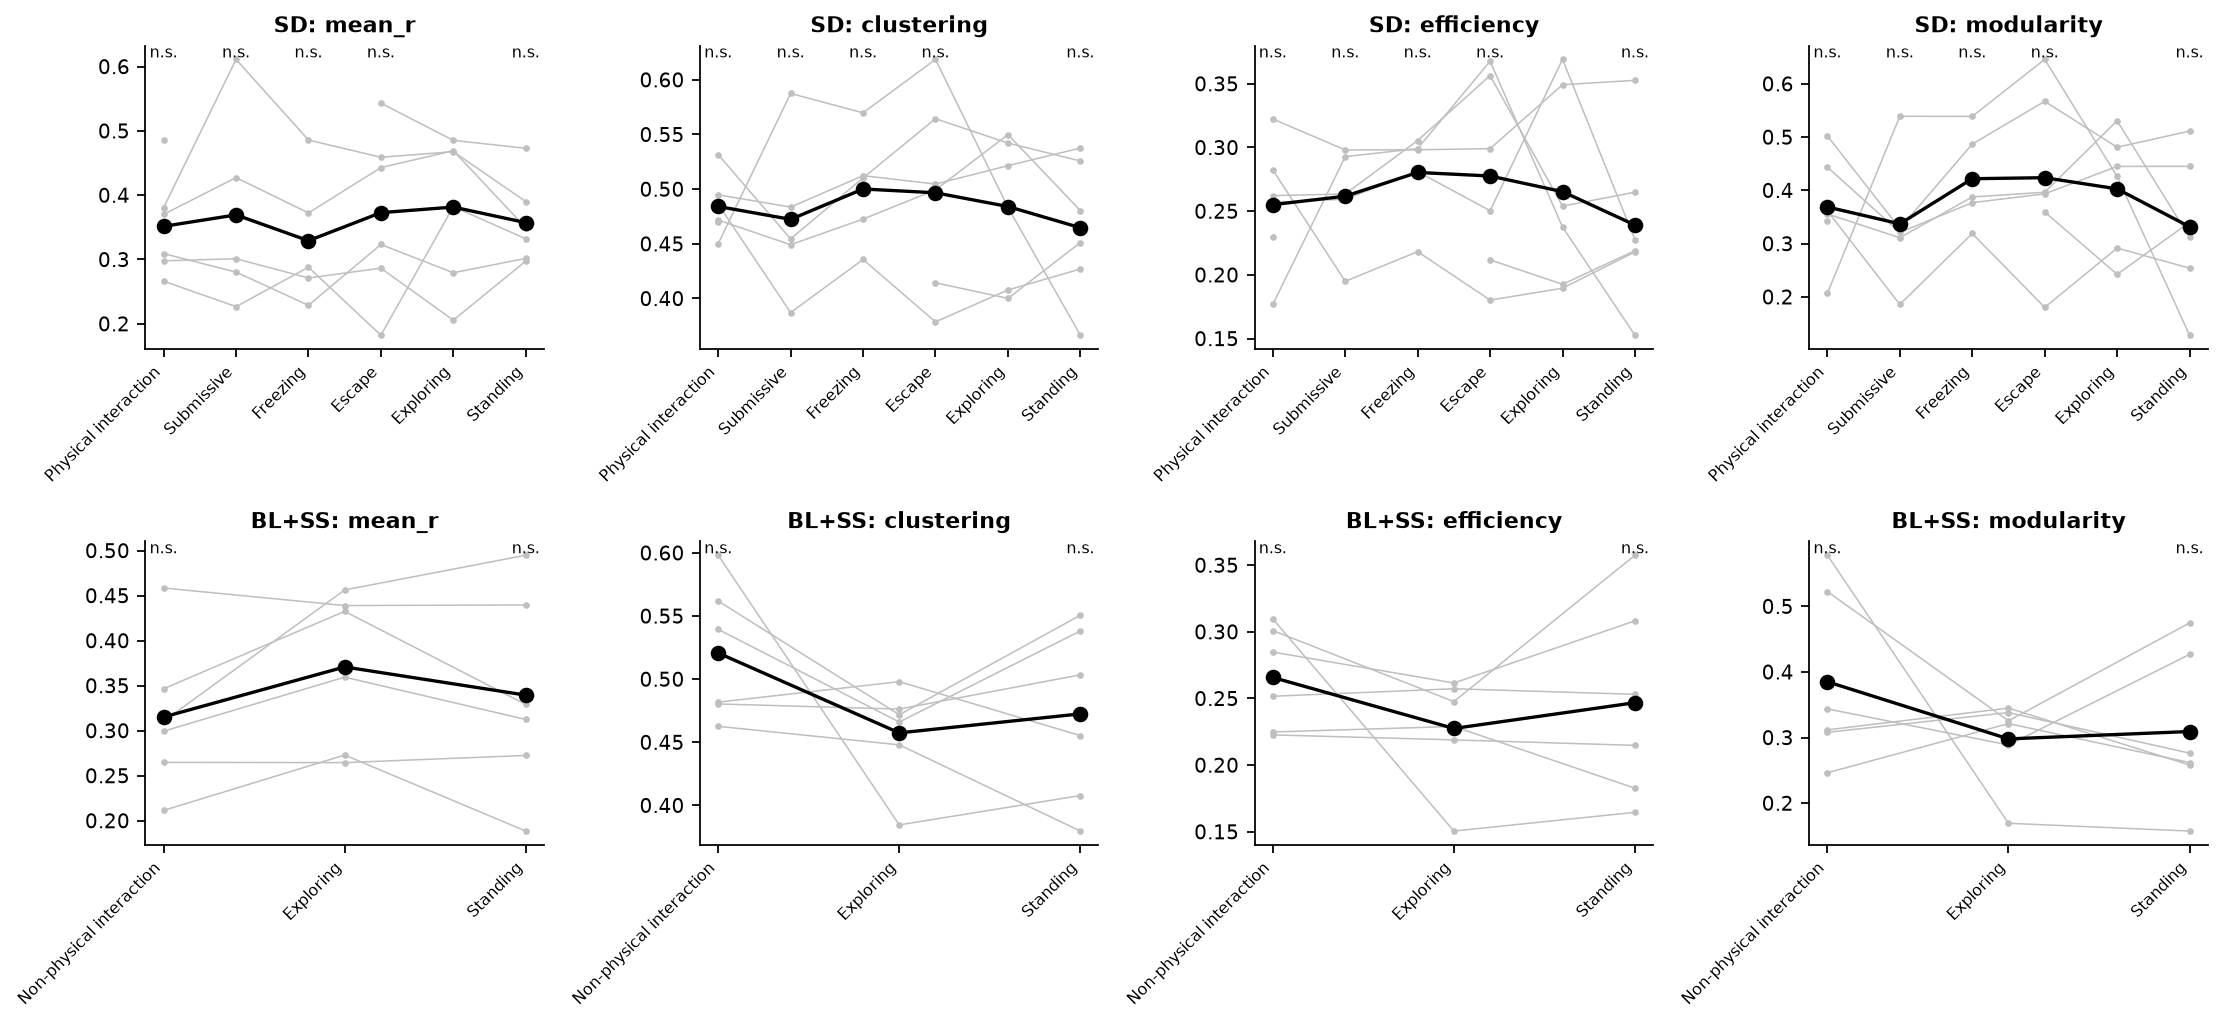
Frame-matched state networks. Eligible states per animal were matched to the smallest state (485 frames median in defeat sessions). Mean pairwise correlation and topology by state are shown in Figure 1. 0 of 28 state-vs-exploring contrasts survived FDR correction. The smallest p-values in the defeat context were Submissive modularity Δ = -0.124 (p = 0.188); Freezing mean_r Δ = -0.0506 (p = 0.438); Physical interaction mean_r Δ = -0.0436 (p = 0.438).
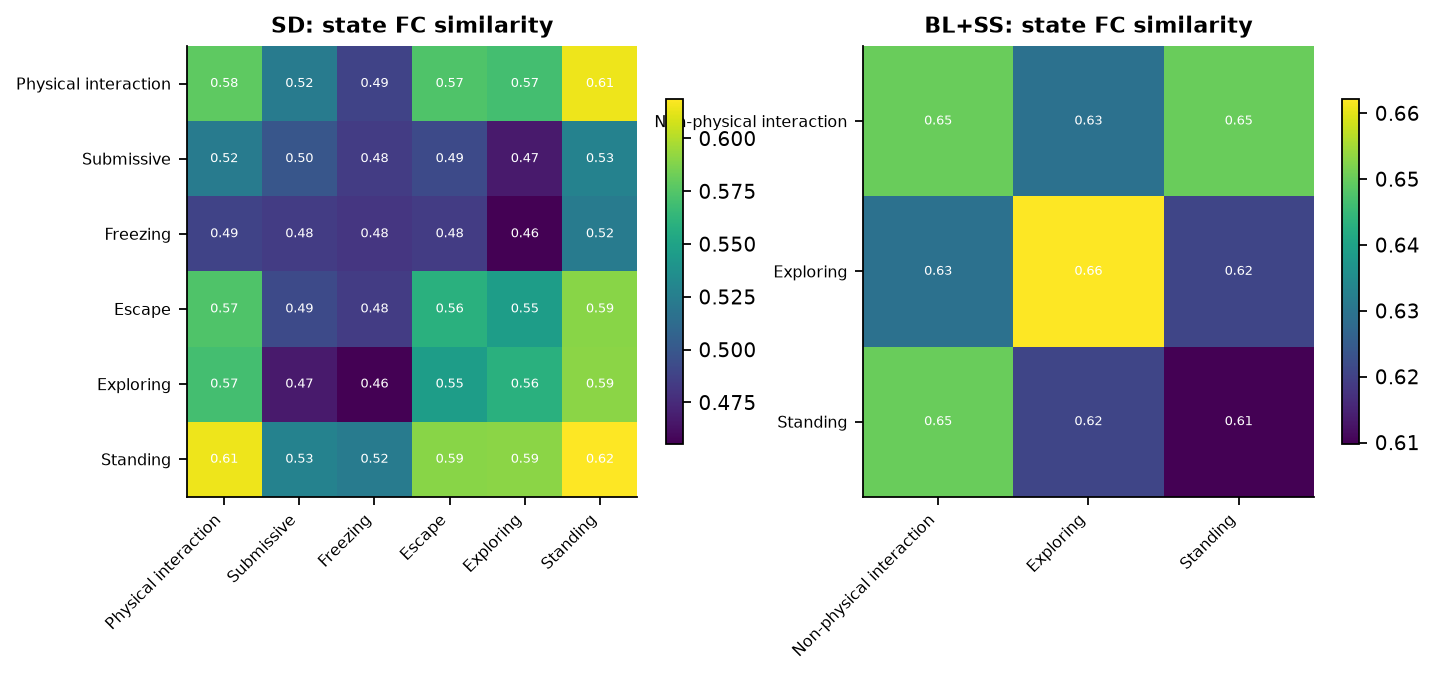
Reconfiguration. In defeat sessions, cross-validated FC similarity between different states averaged 0.570, against 0.573 for the same state across day halves (3/4 animals lower across states; p = 0.312). In BL + SS the corresponding p was p = 0.281 (Table 2, Figure 3). Figure 2 shows which state pairs are most dissimilar.
Figures
Tables
Table 1. State vs exploring contrasts
| context | metric | state | vs | n | median_diff | p | friedman_p | q_fdr |
|---|---|---|---|---|---|---|---|---|
| BL+SS | mean_r | Non-physical interaction | Exploring | 6 | -0.0608 | 0.156 | 0.846 | 0.625 |
| BL+SS | clustering | Non-physical interaction | Exploring | 6 | 0.044 | 0.156 | 0.115 | 0.625 |
| BL+SS | efficiency | Non-physical interaction | Exploring | 6 | 0.0135 | 0.312 | 0.846 | 0.643 |
| BL+SS | mean_r | Standing | Exploring | 6 | -0.0232 | 0.438 | 0.846 | 0.643 |
| BL+SS | clustering | Standing | Exploring | 6 | 0.0252 | 0.562 | 0.115 | 0.643 |
| BL+SS | efficiency | Standing | Exploring | 6 | 0.00498 | 0.562 | 0.846 | 0.643 |
| BL+SS | modularity | Non-physical interaction | Exploring | 6 | 0.0125 | 0.562 | 0.607 | 0.643 |
| BL+SS | modularity | Standing | Exploring | 6 | -0.0356 | 1 | 0.607 | 1 |
| SD | modularity | Submissive | Exploring | 5 | -0.124 | 0.188 | 0.489 | 1 |
| SD | mean_r | Freezing | Exploring | 5 | -0.0506 | 0.438 | 0.918 | 1 |
| SD | mean_r | Physical interaction | Exploring | 6 | -0.0436 | 0.438 | 0.918 | 1 |
| SD | mean_r | Standing | Exploring | 6 | -0.0311 | 0.562 | 0.918 | 1 |
| SD | modularity | Standing | Exploring | 6 | -0.0188 | 0.562 | 0.489 | 1 |
| SD | clustering | Submissive | Exploring | 5 | -0.0379 | 0.625 | 0.389 | 1 |
| SD | clustering | Standing | Exploring | 6 | -0.000129 | 0.688 | 0.389 | 1 |
| SD | mean_r | Escape | Exploring | 6 | 0.0176 | 0.844 | 0.918 | 1 |
| SD | efficiency | Escape | Exploring | 6 | 0.00495 | 0.844 | 0.891 | 1 |
| SD | efficiency | Physical interaction | Exploring | 6 | -0.0093 | 0.844 | 0.891 | 1 |
| SD | modularity | Escape | Exploring | 6 | 0.0173 | 0.844 | 0.489 | 1 |
| SD | modularity | Physical interaction | Exploring | 6 | 0.00996 | 0.844 | 0.489 | 1 |
| SD | mean_r | Submissive | Exploring | 5 | 0.00101 | 1 | 0.918 | 1 |
| SD | clustering | Escape | Exploring | 6 | -0.00126 | 1 | 0.389 | 1 |
| SD | clustering | Freezing | Exploring | 5 | -0.00911 | 1 | 0.389 | 1 |
| SD | clustering | Physical interaction | Exploring | 6 | -0.0186 | 1 | 0.389 | 1 |
| SD | efficiency | Freezing | Exploring | 5 | 0.0287 | 1 | 0.891 | 1 |
| SD | efficiency | Standing | Exploring | 6 | 0.00722 | 1 | 0.891 | 1 |
| SD | efficiency | Submissive | Exploring | 5 | 0.00542 | 1 | 0.891 | 1 |
| SD | modularity | Freezing | Exploring | 5 | 0.00601 | 1 | 0.489 | 1 |
Table 2. Split-half reliability vs cross-state FC similarity
| context | subject | reliability | cross_state |
|---|---|---|---|
| BL+SS | 4703 | 0.796 | 0.799 |
| BL+SS | 6445 | 0.49 | 0.461 |
| BL+SS | 6597 | 0.636 | 0.64 |
| BL+SS | 6669 | 0.47 | 0.467 |
| BL+SS | 6672 | 0.776 | 0.774 |
| BL+SS | 6675 | 0.677 | 0.659 |
| SD | 4703 | 0.769 | 0.767 |
| SD | 6597 | 0.386 | 0.386 |
| SD | 6672 | 0.514 | 0.501 |
| SD | 6675 | 0.62 | 0.624 |
Table 3. Per-animal state networks
| context | subject | state | frames_used | half_frames | split_half_reliability | mean_r | clustering | efficiency | modularity |
|---|---|---|---|---|---|---|---|---|---|
| SD | 4703 | Physical interaction | 735 | 220 | 0.728 | 0.485 | 0.47 | 0.23 | 0.343 |
| SD | 4703 | Escape | 735 | 220 | 0.685 | 0.543 | 0.414 | 0.212 | 0.359 |
| SD | 4703 | Exploring | 735 | 220 | 0.827 | 0.485 | 0.4 | 0.193 | 0.242 |
| SD | 4703 | Standing | 735 | 220 | 0.837 | 0.473 | 0.451 | 0.219 | 0.34 |
| SD | 6445 | Physical interaction | 280 | 17 | 0.381 | 0.532 | 0.262 | 0.502 | |
| SD | 6445 | Submissive | 280 | 17 | 0.611 | 0.455 | 0.263 | 0.328 | |
| SD | 6445 | Freezing | 280 | 17 | 0.486 | 0.51 | 0.305 | 0.487 | |
| SD | 6445 | Escape | 280 | 17 | 0.459 | 0.564 | 0.356 | 0.567 | |
| SD | 6445 | Exploring | 280 | 17 | 0.468 | 0.542 | 0.254 | 0.481 | |
| SD | 6445 | Standing | 280 | 17 | 0.39 | 0.526 | 0.265 | 0.511 | |
| SD | 6597 | Physical interaction | 622 | 297 | 0.412 | 0.309 | 0.495 | 0.322 | 0.444 |
| SD | 6597 | Submissive | 622 | 297 | 0.285 | 0.28 | 0.484 | 0.298 | 0.321 |
| SD | 6597 | Freezing | 622 | 297 | 0.337 | 0.229 | 0.512 | 0.298 | 0.377 |
| SD | 6597 | Escape | 622 | 297 | 0.324 | 0.323 | 0.505 | 0.299 | 0.393 |
| SD | 6597 | Exploring | 622 | 297 | 0.412 | 0.279 | 0.521 | 0.349 | 0.445 |
| SD | 6597 | Standing | 622 | 297 | 0.548 | 0.302 | 0.538 | 0.353 | 0.445 |
| SD | 6669 | Physical interaction | 485 | 1 | 0.266 | 0.45 | 0.177 | 0.207 | |
| SD | 6669 | Submissive | 485 | 1 | 0.227 | 0.587 | 0.293 | 0.539 | |
| SD | 6669 | Freezing | 485 | 1 | 0.288 | 0.57 | 0.299 | 0.539 | |
| SD | 6669 | Escape | 485 | 1 | 0.182 | 0.619 | 0.368 | 0.646 |
Limitations
- Frames within a state come from many bouts. Correlations therefore mix within-bout co-fluctuation with between-bout rate differences.
- States differ in locomotion and arousal. Network differences may reflect these correlates rather than social meaning per se.
- Rare states (attack, danger) did not reach the frame threshold in enough animals.
References
- Vinck M. et al. (2015) Arousal and locomotion make distinct contributions to cortical activity patterns and visual encoding. Neuron 86:740–754.
- Stringer C. et al. (2019) Spontaneous behaviors drive multidimensional, brainwide activity. Science 364:eaav7893.
- Frost N.A. et al. (2021) Dynamic patterns of correlated activity in the prefrontal cortex encode information about social behavior. PLoS Biol 19:e3001235.
- Gründemann J. et al. (2019) Amygdala ensembles encode behavioral states. Science 364:eaav8736.