Study S09 · generated 2026-10-13T21:32:28+00:00 · 19.6 s
Population dynamics: dimensionality and hidden states
Participation-ratio dimensionality and hidden Markov model population states across CSDS.
Question
Does defeat compress or expand the dimensionality of population activity, and does the population visit different discrete states in each context, states that track defensive behavior?
Background & rationale
The participation ratio summarises how many dimensions population activity occupies (Gao & Ganguli 2015; Recanatesi et al. 2022). Lower dimensionality indicates stronger shared fluctuations, a population-level counterpart of increased network coupling. Hidden Markov models segment population activity into recurring discrete states (Mazzucato et al. 2015). In CSDS, susceptible mice show more distinct basolateral amygdala population states in Neuropixels recordings (PMC10854313), and HMM-GLM models decode social-competition states from mPFC ensembles (Padilla-Coreano et al. 2022).
Methodology
Dimensionality. For each session, 1-s binned inferred spikes were z-scored per neuron, and the participation ratio PR = (Σλᵢ)² / Σλᵢ² was computed from the eigenvalues λ of the neuron covariance matrix. PR / number of neurons gives the normalised dimensionality. Conditions were compared on per-animal means over days that contain all of BL, SD and SS (days 1–9, day 7 excluded; Friedman, exact Wilcoxon, FDR across metrics × contrasts).
Hidden Markov model. Per animal, 1-s bins from all sessions were z-scored per neuron and projected on the top 10 principal components. A Gaussian HMM with 6 states (diagonal covariance, 200 EM iterations, fixed seed) was fit with session boundaries respected, and Viterbi decoding gave the state sequence. Per session we computed: - occupancy entropy, in bits (how evenly states are used); - mean dwell time, in seconds; - transitions per minute; - the occupancy distribution.
Context specificity of states: the Jensen–Shannon divergence between occupancy distributions of different-day sessions with the same context vs different contexts (per-animal means, one-sided exact Wilcoxon).
State–behavior coupling. In defeat sessions, mutual information between HMM state and annotated behavior was compared with 200 circular shifts of the full 1-s behavior sequence relative to the state sequence (shift ≥ 30 s). MI was computed on bins whose behavior label, after shifting, is a single annotated behavior. Per animal, z = (MI − null mean) / null SD and p = (1 + #null ≥ MI) / 201; the group test is a one-sided exact Wilcoxon of z.
Parameters
| Parameter | Value |
|---|---|
bin_s | 1.0 |
n_states | 6 |
n_pcs | 10 |
covariance | diag |
Highlights
null
Dimensionality during defeat
-0.002 PR/N
Median paired change (SD − BL), 2/6 animals higher, p = 0.219, q = 0.917.
null
Context-specific population states
JS 0.532 vs 0.549
Occupancy divergence for same- vs different-context sessions (different days), p = 0.078.
null
States track defeat behavior
MI z = 0.9
1/6 animals above circular-shift null; group p = 0.078.
Results
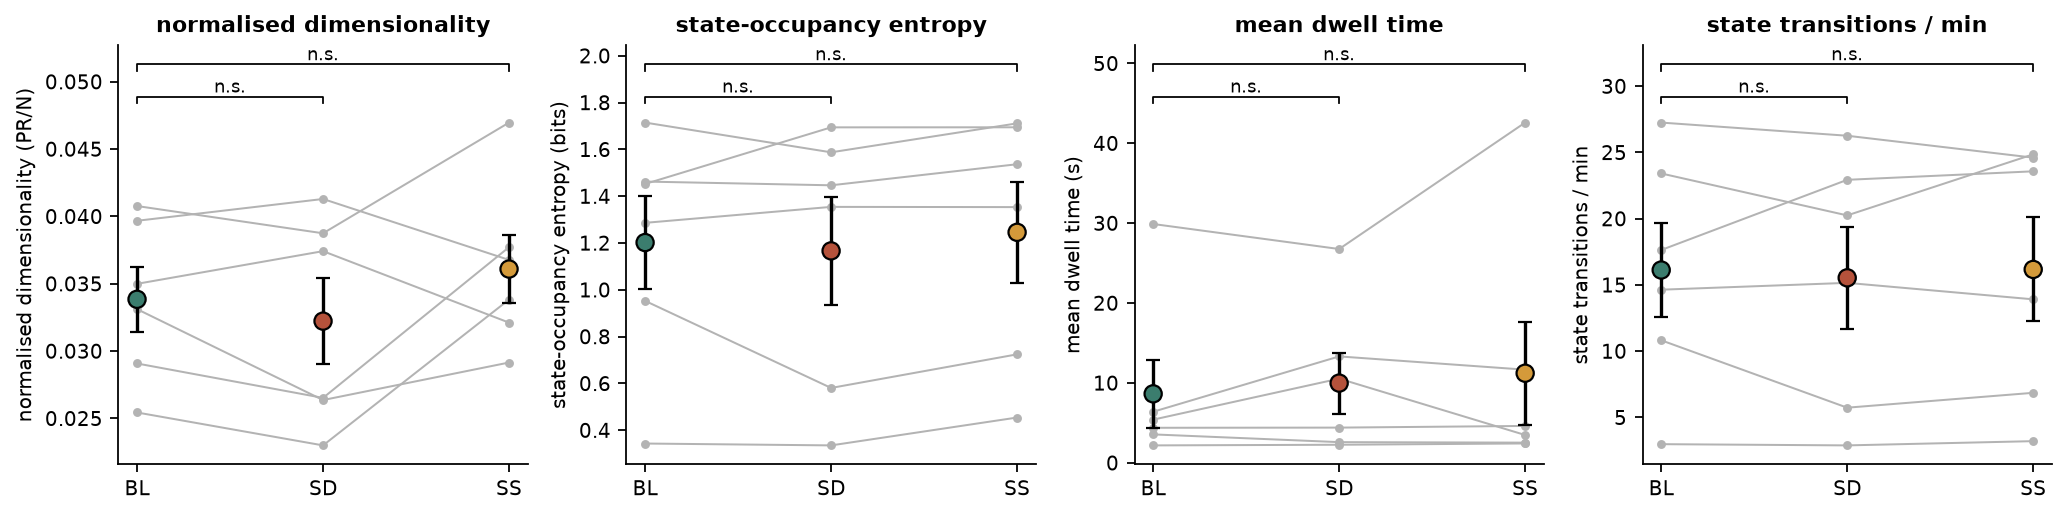
Dimensionality. Normalised participation ratio averaged BL 0.034, SD 0.032 and SS 0.036 (days 1–9, day 7 excluded; SD vs BL median Δ = -0.002, p = 0.219). Lower values mean activity is dominated by fewer shared modes. All contrasts are in Table 1 and Figure 1.
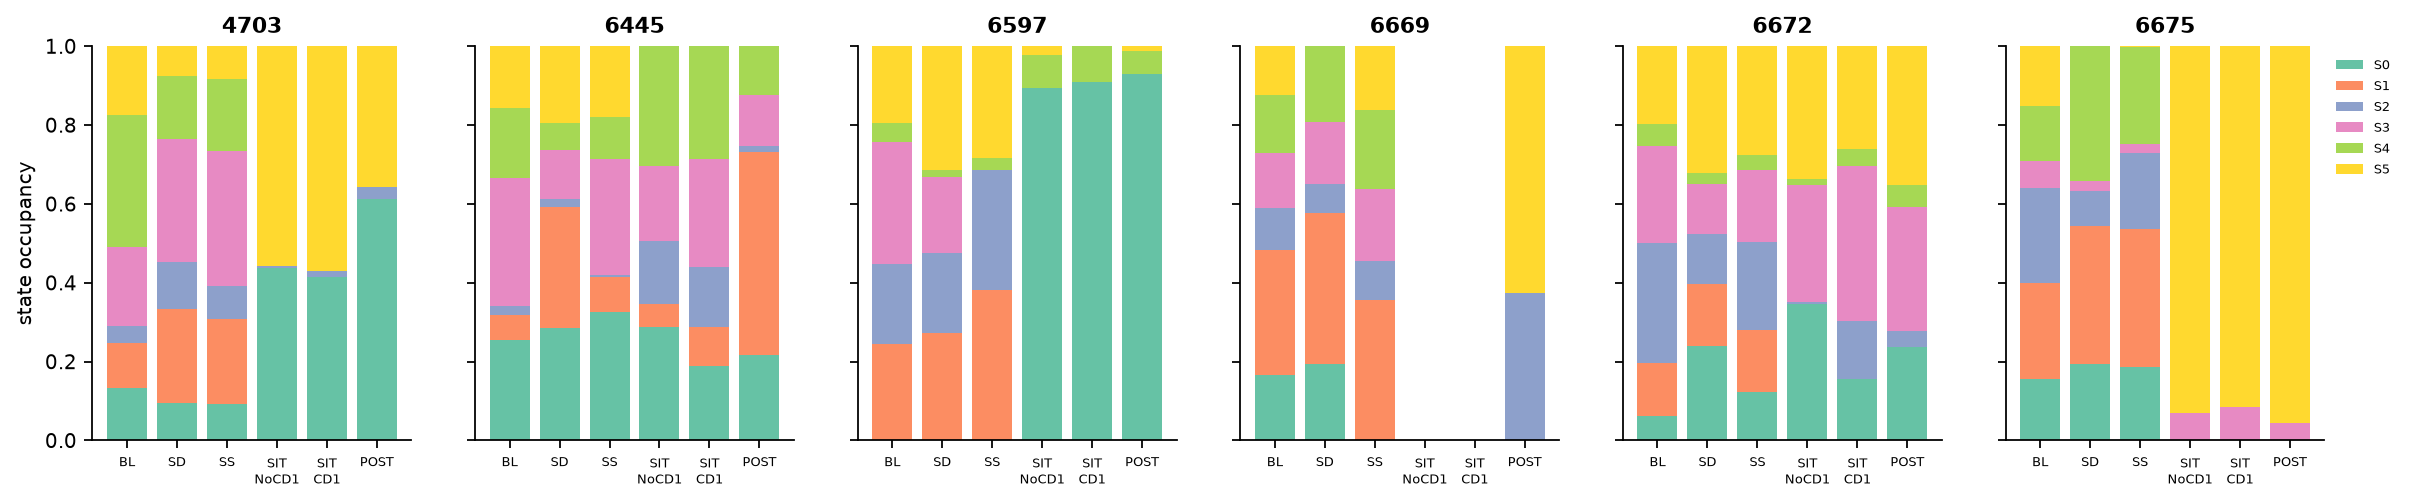
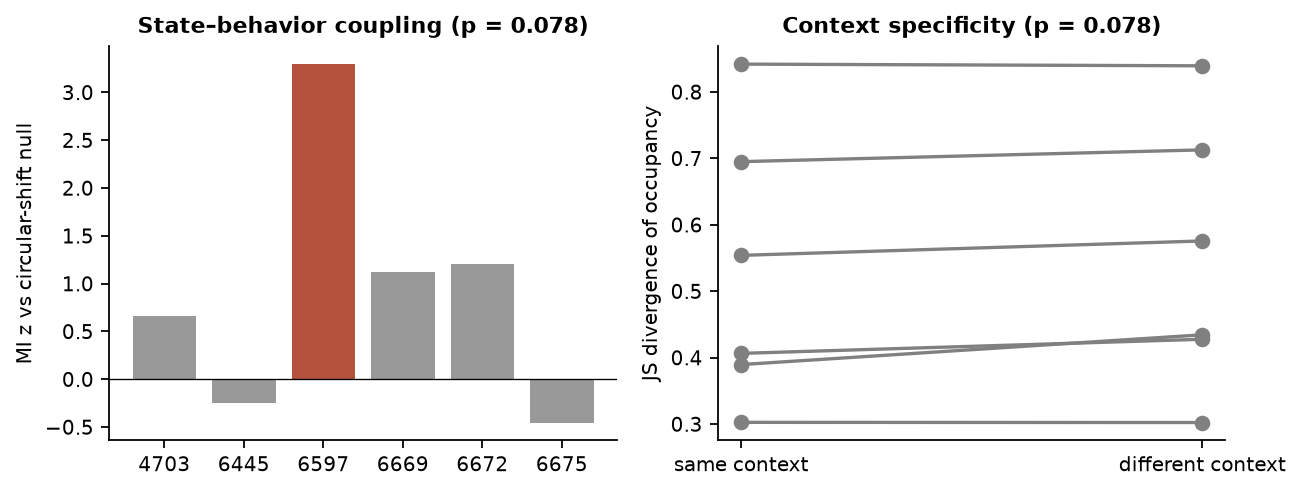
Hidden states. A 6-state HMM per animal segmented population activity into recurring states. State-occupancy divergence between different-day sessions averaged 0.532 (JS) for the same context and 0.549 for different contexts (p = 0.078). State occupancy was therefore not detectably context-specific (Figure 2, Table 2).
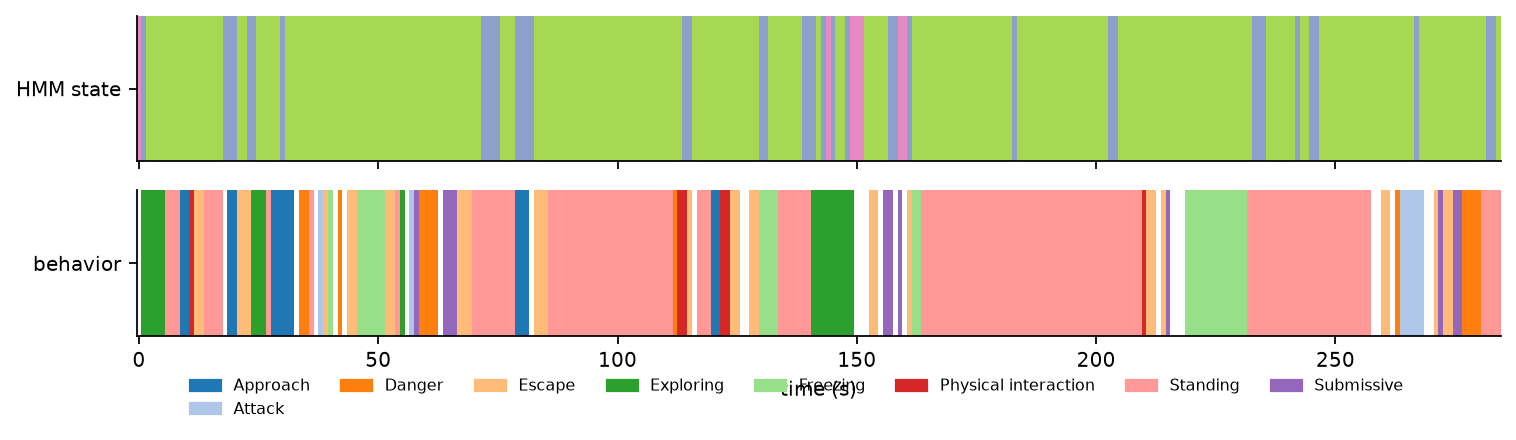
States and behavior. In defeat sessions, mutual information between HMM state and annotated behavior exceeded the circular-shift null in 1/6 animals (mean z = 0.9, group p = 0.078; Figure 4). An example state sequence aligned with the ethogram is shown in Figure 3.
Figures
Tables
Table 1. Dimensionality and HMM measures: condition contrasts
| metric | contrast | n | median_diff | dz | p | q_fdr | friedman_p |
|---|---|---|---|---|---|---|---|
| PR_norm | SD vs BL | 6 | -0.00223 | -0.489 | 0.219 | 0.917 | 0.607 |
| PR_norm | SS vs BL | 6 | 0.00166 | 0.369 | 0.438 | 0.917 | 0.607 |
| PR_norm | SS vs SD | 6 | 0.0055 | 0.52 | 0.312 | 0.917 | 0.607 |
| occupancy_entropy | SD vs BL | 6 | -0.012 | -0.173 | 0.688 | 0.917 | 0.223 |
| occupancy_entropy | SS vs BL | 6 | 0.0706 | 0.281 | 0.438 | 0.917 | 0.223 |
| occupancy_entropy | SS vs SD | 6 | 0.105 | 1.24 | 0.0938 | 0.917 | 0.223 |
| dwell_s | SD vs BL | 6 | 0.0521 | 0.349 | 0.562 | 0.917 | 0.607 |
| dwell_s | SS vs BL | 6 | 0.237 | 0.465 | 0.562 | 0.917 | 0.607 |
| dwell_s | SS vs SD | 6 | 0.0489 | 0.161 | 1 | 1 | 0.607 |
| transitions_per_min | SD vs BL | 6 | -0.543 | -0.165 | 0.688 | 0.917 | 0.607 |
| transitions_per_min | SS vs BL | 6 | -0.25 | 0.0129 | 1 | 1 | 0.607 |
| transitions_per_min | SS vs SD | 6 | 0.481 | 0.284 | 0.844 | 1 | 0.607 |
Table 2. Context specificity of HMM state occupancy
| subject | JS_same_context | JS_different_context |
|---|---|---|
| 4703 | 0.407 | 0.428 |
| 6445 | 0.39 | 0.434 |
| 6597 | 0.303 | 0.302 |
| 6669 | 0.842 | 0.839 |
| 6672 | 0.554 | 0.576 |
| 6675 | 0.695 | 0.713 |
Table 3. HMM state – behavior mutual information (defeat sessions)
| subject | MI_bits | null_mean_bits | z | p |
|---|---|---|---|---|
| 4703 | 0.114 | 0.0913 | 0.658 | 0.224 |
| 6445 | 0.141 | 0.154 | -0.247 | 0.622 |
| 6597 | 0.163 | 0.0879 | 3.3 | 0.00498 |
| 6669 | 0.379 | 0.281 | 1.13 | 0.149 |
| 6672 | 0.122 | 0.0962 | 1.21 | 0.134 |
| 6675 | 0.0937 | 0.101 | -0.452 | 0.667 |
Table 4. Session-level dynamics measures
| key | subject | condition | day | mapping | PR | PR_norm | occupancy_entropy | dwell_s | transitions_per_min |
|---|---|---|---|---|---|---|---|---|---|
| 4703_BL_D1 | 4703 | BL | 1 | supported | 3.97 | 0.0378 | 1.31 | 4.84 | 12.2 |
| 4703_SD_D1 | 4703 | SD | 1 | supported | 2.56 | 0.0244 | 1.85 | 2.77 | 21.5 |
| 4703_SS_D1 | 4703 | SS | 1 | supported | 3.03 | 0.0288 | 1.69 | 2.6 | 22.9 |
| 4703_BL_D2 | 4703 | BL | 2 | supported | 3.15 | 0.03 | 1.54 | 4.34 | 13.6 |
| 4703_SD_D2 | 4703 | SD | 2 | supported | 2.85 | 0.0271 | 1.69 | 2.6 | 22.9 |
| 4703_SS_D2 | 4703 | SS | 2 | supported | 2.99 | 0.0285 | 1.85 | 2.8 | 21.3 |
| 4703_BL_D3 | 4703 | BL | 3 | supported | 3.68 | 0.035 | 1.5 | 3.29 | 18 |
| 4703_SD_D3 | 4703 | SD | 3 | supported | 2.97 | 0.0283 | 1.86 | 2.47 | 24.1 |
| 4703_SS_D3 | 4703 | SS | 3 | supported | 3.16 | 0.0301 | 1.72 | 2.38 | 25.1 |
| 4703_BL_D5 | 4703 | BL | 5 | supported | 1.98 | 0.0189 | 1.37 | 2.7 | 22.1 |
| 4703_SD_D5 | 4703 | SD | 5 | supported | 2.09 | 0.0199 | 1.48 | 2.63 | 22.7 |
| 4703_SS_D5 | 4703 | SS | 5 | supported | 2.98 | 0.0284 | 1.44 | 2.56 | 23.3 |
Limitations
- The number of HMM states (6) and PCs (10) were fixed a priori rather than selected by cross-validated likelihood.
- PR depends on the number of neurons and samples. Comparisons are therefore within animal and between equal-length sessions.
- The HMM is fit to all sessions of an animal, including day 11, so states are defined on data that also enter the condition contrasts. Contrasts compare how the same states are used, not whether states differ.
- BL, SD and SS are always recorded in that order within a day, so condition contrasts are confounded with position in the recording.
References
- Gao P. & Ganguli S. (2015) On simplicity and complexity in the brave new world of large-scale neuroscience. Curr Opin Neurobiol 32:148–155.
- Recanatesi S. et al. (2022) A scale-dependent measure of system dimensionality. Patterns 3:100555.
- Mazzucato L., Fontanini A. & La Camera G. (2015) Dynamics of multistable states during ongoing and evoked cortical activity. J Neurosci 35:8214–8231.
- Identifying and modulating neural signatures of stress susceptibility and resilience enables control of anhedonia (BLA/vCA1 Neuropixels, HMM states). PMC10854313.
- Padilla-Coreano N. et al. (2022) Cortical ensembles orchestrate social competition through hypothalamic outputs. Nature 603:667–671.
- Lin J. (1991) Divergence measures based on the Shannon entropy. IEEE Trans Inf Theory 37:145–151.